
This is the second blog in our series explaining the most common scenarios involving performance issues for Amazon Aurora PostgreSQL. Read Part 1 here which focuses on idle connections, MultiXacts, and query memory consumption.
In this second part of the series, we look at the following issues:
- Greater than 64 Subtransactions
- 100% CPU due to runaway query
- Increased Logical Replication Lag
Greater than 64 Subtransactions
PostgreSQL supports nested transactions through the SAVEPOINT command, which allows a large transaction to be divided into smaller subtransactions. A subtransaction can commit or roll back independently without impacting the parent transaction. The relationship between transactions and subtransactions (XIDs and SubXIDs) is tracked in the SLRU (Simple Least Recently Used) cache.
Each backend can cache up to 64 subtransactions (PGPROC_MAX_CACHED_SUBXIDS = 64). As long as subtransactions remain within this limit, lookups are efficient. Once the number exceeds 64, tracking overflows to the pg_subtrans directory on disk, causing a cache overflow. In this case, lookups take a slower path that requires locking SLRU pages and potentially performing additional disk I/O.
In highly concurrent environments, the lightweight locks used to coordinate SLRU page access — combined with the extra I/O — can become a serious performance bottleneck.
Problem
- Performance degradation of Aurora PostgreSQL
- The database appears stalled
- CPU, DBLoad, BufferCacheHitRatio appear healthy
- We have an application that processes data and performs updates on it
Symptoms
- Stalled database queries
- 500 errors
- Session timeouts
How to simulate
Create a new database:
psql
create database subtran;
\c subtran
\q
Generate sample dataset:
pgbench -i --scale=100 subtran
 SELECT pg_size_pretty(pg_database_size('subtran'));
 pg_size_pretty
----------------
 1503 MB
(1 row)
Create and review SQL script, which creates a transaction which performs selects and updates with 90 savepoints:
export rnd=$((1 + RANDOM % 10000000))
  echo "BEGIN;" > "t90.sql"
  echo "SELECT abalance FROM pgbench_accounts WHERE aid = $rnd;" >> "t90.sql"
  for (( i=1; i<=90; i++ )); do
    echo "SAVEPOINT s_${i};" >> "t90.sql"
    echo "SELECT count(*) FROM pgbench_accounts WHERE aid BETWEEN $rnd AND $rnd + 100;" >> "t90.sql"
    echo "UPDATE pgbench_accounts SET abalance = abalance + 50 WHERE aid = $rnd;" >> "t90.sql"
  done
  echo "COMMIT;" >> "t90.sql"
$ cat t90.sql
BEGIN;
SELECT abalance FROM pgbench_accounts WHERE aid = 707;
SAVEPOINT s_1;
SELECT count(*) FROM pgbench_accounts WHERE aid BETWEEN 707 AND 707 + 100;
UPDATE pgbench_accounts SET abalance = abalance + 50 WHERE aid = 707;
SAVEPOINT s_2;
SELECT count(*) FROM pgbench_accounts WHERE aid BETWEEN 707 AND 707 + 100;
UPDATE pgbench_accounts SET abalance = abalance + 50 WHERE aid = 707;
....................................................
SELECT count(*) FROM pgbench_accounts WHERE aid BETWEEN 707 AND 707 + 100;
UPDATE pgbench_accounts SET abalance = abalance + 50 WHERE aid = 707;
SAVEPOINT s_89;
SELECT count(*) FROM pgbench_accounts WHERE aid BETWEEN 707 AND 707 + 100;
UPDATE pgbench_accounts SET abalance = abalance + 50 WHERE aid = 707;
SAVEPOINT s_90;
SELECT count(*) FROM pgbench_accounts WHERE aid BETWEEN 707 AND 707 + 100;
UPDATE pgbench_accounts SET abalance = abalance + 50 WHERE aid = 707;
COMMIT;
Generate load via pgbench (script runs ~10 minutes):
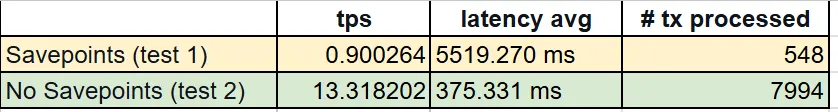
pgbench --progress-timestamp -M prepared -n -T 600 -P 5 -c 5 -f t90.sql subtran

pgbench (14.19, server 15.5)
progress: 1759343672.356 s, 3.6 tps, lat 987.375 ms stddev 483.341
progress: 1759343677.356 s, 2.8 tps, lat 1894.017 ms stddev 1023.823
progress: 1759343682.356 s, 2.4 tps, lat 1817.096 ms stddev 979.584
progress: 1759343687.356 s, 2.4 tps, lat 2141.482 ms stddev 1014.016
progress: 1759343692.356 s, 2.2 tps, lat 2290.252 ms stddev 984.400
..................................
transaction type: t90.sql
scaling factor: 1
query mode: prepared
number of clients: 5
number of threads: 1
duration: 600 s
number of transactions actually processed: 548
latency average = 5519.270 ms
latency stddev = 4025.358 ms
initial connection time = 69.516 ms
tps = 0.900264 (without initial connection time)
The number of TPS (Transaction per Second) was less than 1, the average transaction latency is at ~5.5s
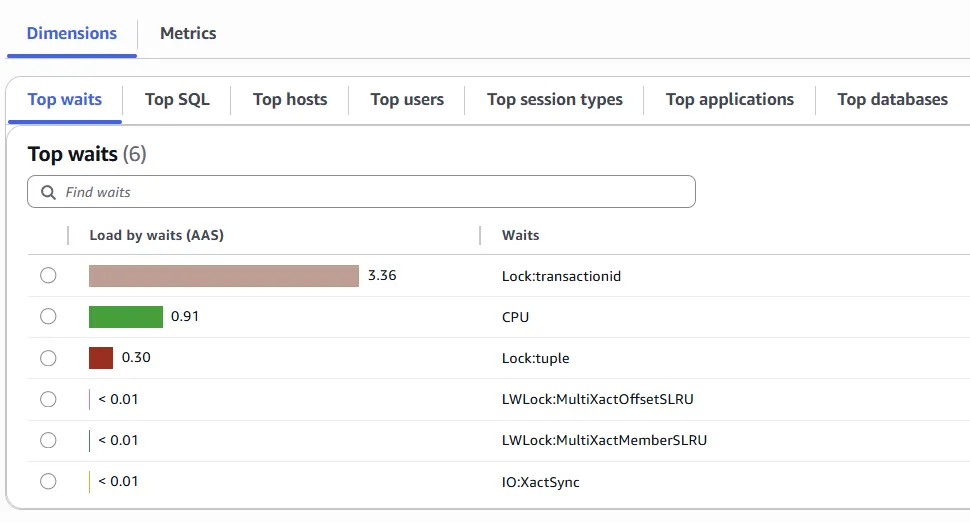
- The Lock:transactionid event occurs when a transaction is waiting for a row-level lock. The session that shows the Lock:transactionid wait event is blocked because of this lock. After the blocking transaction ends in either a COMMIT or ROLLBACK statement, the blocked transaction can proceed.
- The Lock:tuple event indicates that a backend is waiting to acquire a lock on a tuple while another backend holds a conflicting lock on the same tuple.
- The LWLock:MultiXactMemberBuffer is a process is waiting for I/O on a simple least-recently used (SLRU) buffer for a multixact member.
How to resolve
Each time a SAVEPOINT is called, PostgreSQL creates a subtransaction within the parent transaction. The SLRU (Simple Least Recently Used) cache can track up to 64 subtransactions per transaction; beyond that, it spills into the pg_subtrans directory on disk.
In highly concurrent systems, multiple sessions accessing the small SLRU cache (just 32 pages) can lead to lock contention and disk reads, causing slower response times. Long-running transactions hold locks until completion, and when combined with more than 64 subtransactions, this often results in system stalls.
Many ORMs and frameworks support PostgreSQL SAVEPOINTS. This can cause applications to generate over 64 subtransactions in a single transaction, degrading performance without developers realizing it.
Subtransactions are also created implicitly when:
- PL/pgSQL functions or procedures use exception handlers (BEGIN / EXCEPTION WHEN .. / END)
- The JDBC driver parameter autosave is set to always or conservative, causing PostgreSQL to issue a SAVEPOINT before each query
Exceeding 64 subtransactions can trigger lock contention and blocking, and in extreme cases, stall the system. The following best practices help avoid this issue:
- Eliminate or minimize explicit use of SAVEPOINT
- Review application code paths to reduce unnecessary subtransactions
- Audit PL/pgSQL functions to limit implicit subtransactions from exception handling
- Check database driver configurations to prevent implicit SAVEPOINT creation
- Avoid long-running transactions whenever possible
export rnd=$((1 + RANDOM % 10000000))
  echo "BEGIN;" > "t90.sql"
  echo "SELECT abalance FROM pgbench_accounts WHERE aid = $rnd;" >> "t90.sql"
  for (( i=1; i<=90; i++ )); do
    echo "SELECT count(*) FROM pgbench_accounts WHERE aid BETWEEN $rnd AND $rnd + 100;" >> "t90.sql"
    echo "UPDATE pgbench_accounts SET abalance = abalance + 50 WHERE aid = $rnd;" >> "t90.sql"
  done
  echo "COMMIT;" >> "t90.sql"
$ cat t90.sql
BEGIN;
SELECT abalance FROM pgbench_accounts WHERE aid = 3050;
SELECT count(*) FROM pgbench_accounts WHERE aid BETWEEN 3050 AND 3050 + 100;
UPDATE pgbench_accounts SET abalance = abalance + 50 WHERE aid = 3050;
SELECT count(*) FROM pgbench_accounts WHERE aid BETWEEN 3050 AND 3050 + 100;
..................................
SELECT count(*) FROM pgbench_accounts WHERE aid BETWEEN 3050 AND 3050 + 100;
UPDATE pgbench_accounts SET abalance = abalance + 50 WHERE aid = 3050;
COMMIT;
pgbench --progress-timestamp -M prepared -n -T 600 -P 5 -c 5 -f t90.sql subtran

transaction type: t90.sql
scaling factor: 1
query mode: prepared
number of clients: 5
number of threads: 1
duration: 600 s
number of transactions actually processed: 7994
latency average = 375.331 ms
latency stddev = 187.323 ms
initial connection time = 66.330 ms
tps = 13.318202 (without initial connection time)
Conclusions
- Exceeding 64 subtransactions can cause the system to stall
- Subtransactions may be created implicitly without developers realizing it
- Reviewing application code is essential to reduce or eliminate unnecessary subtransactions
- Long-running transactions amplify the negative effects of subtransactions and should be avoided
100% CPU due to run-away query
CPU is a critical resource for PostgreSQL performance, as every process depends on it to run. Excessive CPU usage can lead to long waits, growing queues, and higher response times. In severe cases, it may render the system unresponsive and even trigger a failover. When high CPU usage is not driven by traffic, inefficient queries are often the primary cause.
Problem
Our Aurora PostgreSQL database has been running fine until yesterday. Something happened today that drove the CPU usage to 100%. Everything takes much longer to run. Production system is down because of that.
Symptoms
- CPU Utilization Total (Percent) metric is at 100 percent
How to simulate
Create sample database:
psql
 Create database dbcpu;
 \c dbcpu
 \q
Generate sample dataset:
  pgbench -i --fillfactor=100 --scale=100 dbcpu

  psql
  SELECT pg_size_pretty(pg_database_size('dbcpu'));
  \q

 pg_size_pretty
----------------
 1503 MB
(1 row)
Start a low volume (100 TPS) read-only workload, and let it run for 10 mins
pgbench --progress-timestamp -n -T 1800 -P 5 -c 5 -R 100 -b tpcb-like@20 -b select-only@80 dbcpu
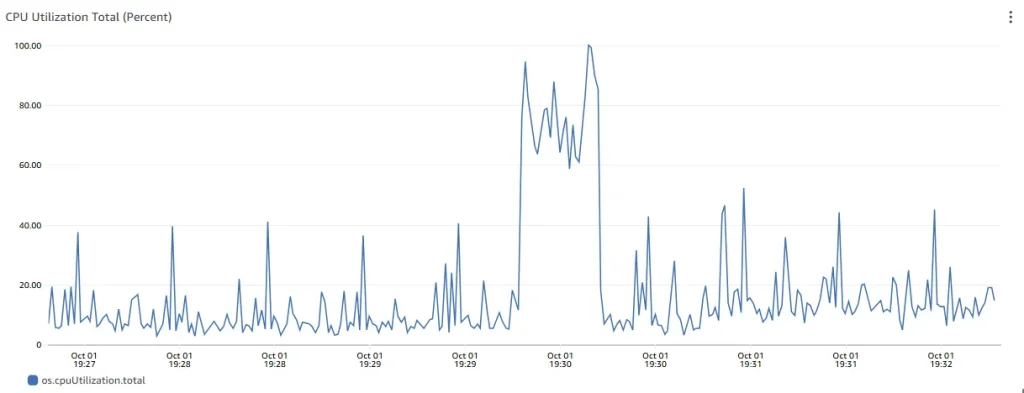
Typical load, the system total CPU usage ranges from 10% to 40%.
Observe system CPU usage with run-away query:
 psql dbcpu
  SELECT count(*) from pgbench_accounts a, pgbench_accounts b, pgbench_accounts c;
Press enter or click to view image in full size
PostgreSQL can experience high CPU usage for several reasons, with the most common being:
- High number of active connections: Each connection requires CPU time to execute. When the number of active connections exceeds the system’s CPU capacity, demand spikes, wait queues grow, and performance degrades
- Inefficient or runaway queries: Poorly written or suboptimal queries can consume excessive CPU resources. For example, a query performing a full table scan instead of using an index can significantly increase CPU usage
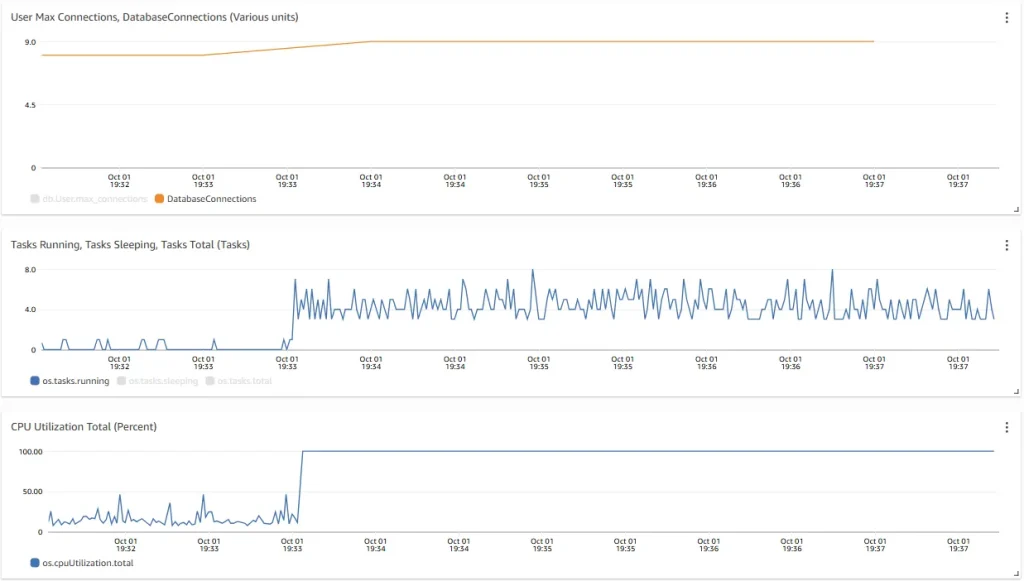
Number of connections is stable and did not change when CPU load reached 100%
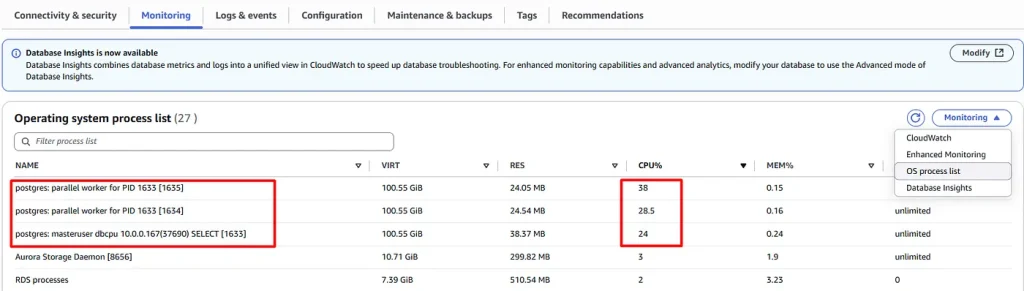
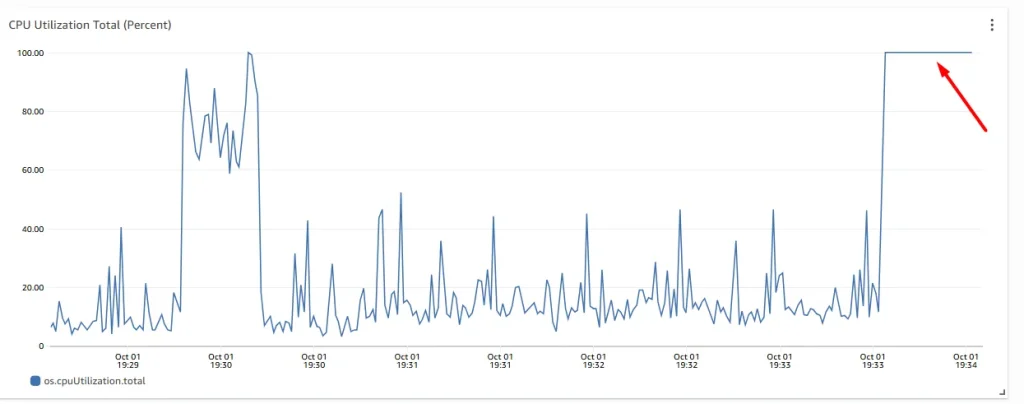
- Single process with PID 1633 running a Select query was using 91% of the system CPU
- PID 1633 was executing with a parallel plan with 2 workers
SELECT * from pg_stat_activity where pid = 1633;

-[ RECORD 1 ]----+---------------------------------------------------------------------------------
datid            | 36874
datname          | dbcpu
pid              | 1633
leader_pid       |
usesysid         | 16400
usename          | masteruser
application_name | psql
client_addr      | 10.0.0.167
client_hostname  |
client_port      | 37690
backend_start    | 2025-10-01 19:33:32.765452+00
xact_start       | 2025-10-01 19:33:32.781624+00
query_start      | 2025-10-01 19:33:32.781624+00
state_change     | 2025-10-01 19:33:32.781624+00
wait_event_type  |
wait_event       |
state            | active
backend_xid      |
backend_xmin     | 1160611
query_id         | -6760263862883825002
query            | SELECT count(*) from pgbench_accounts a, pgbench_accounts b, pgbench_accounts c;
backend_type     | client backend
The Query column shows the full sql text of the query that’s consuming 91% of the system CPU.
We can Increase available CPU, or Optimize Query:
- check for up-to-date statistics
- check for any missing index
- rewriting the query
- partition table if dataset is large
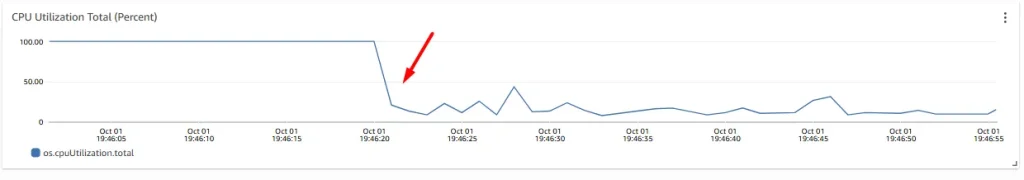
or stop the query execution:
SELECT pg_cancel_backend(1633);

-[ RECORD 1 ]-----+--
pg_cancel_backend | t
Conclusions
- A single run-away query can drive system CPU usage to 100%
- Stop execution of run-away query can immediately relieee system from CPU pressure, and allow time for query tuning
Increased Logical Replication Lag
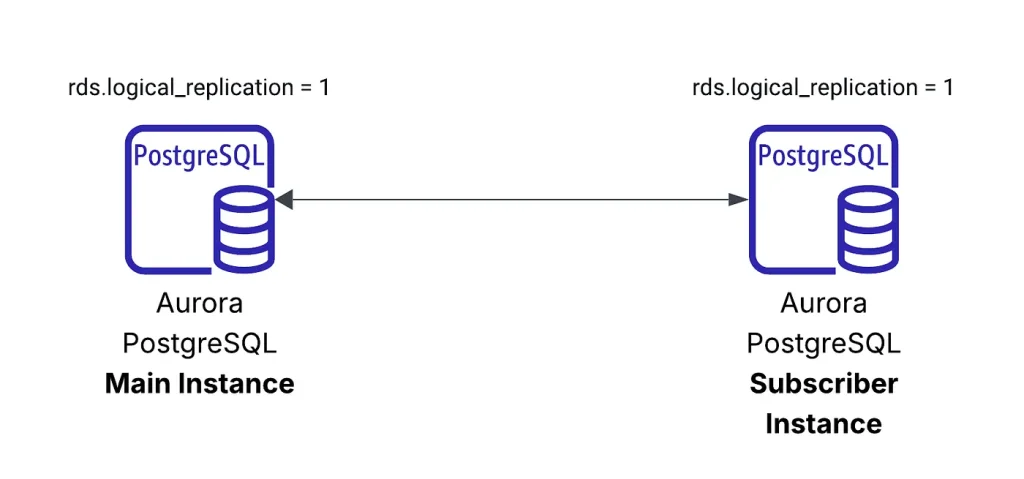
Logical replication in PostgreSQL follows a publish–subscribe model, where a publisher streams change records from the write-ahead log (WAL) to one or more subscribers. The subscribers then apply these changes to their tables, keeping them synchronized with the publisher’s data.
With Aurora PostgreSQL, logical replication allows you to replicate and synchronize specific tables instead of the entire database instance, making it useful for selective data sharing or incremental migrations.
Problem
You need to replicate data from the primary database to a secondary database that supports a heavy read workload. To avoid bottlenecks, the replication process must be fast and efficient while still maintaining data integrity. However, the default logical replication settings on the primary database prioritize consistency over performance and may not be ideal for this scenario.
Symptoms
- Secondary database is experiencing high replication lag
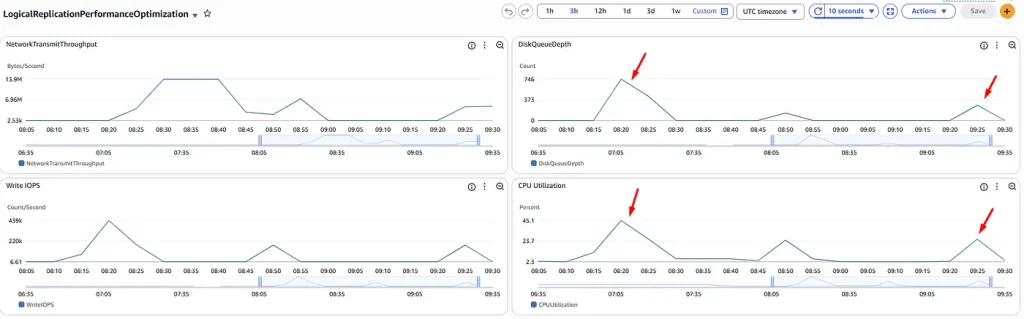
- Publisher has elevated CPU & DiskWrite IOPS metrics
How to simulate
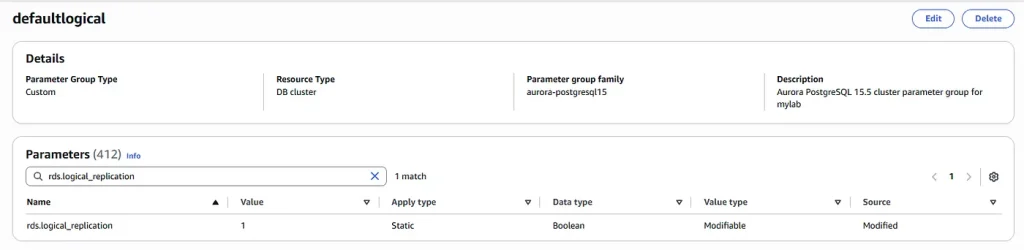
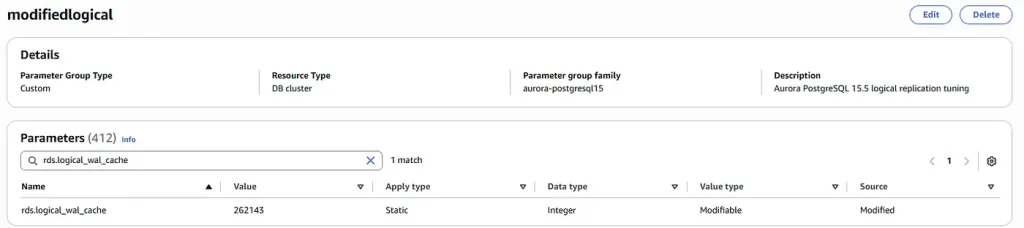
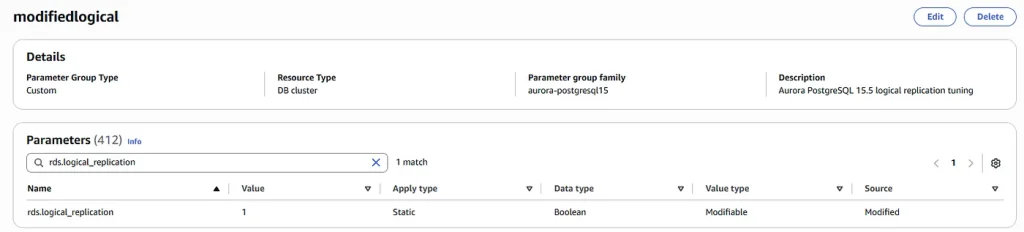
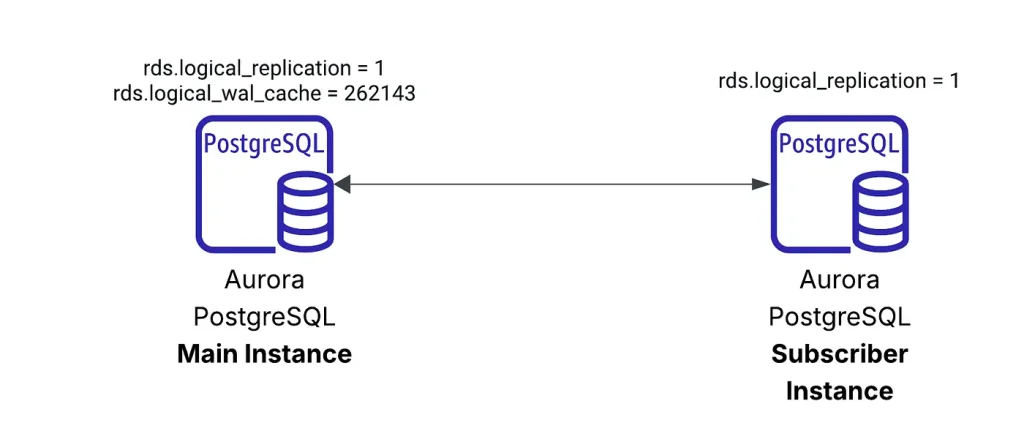
Create 2 cluster parameter groups with rds.logical_replication=1
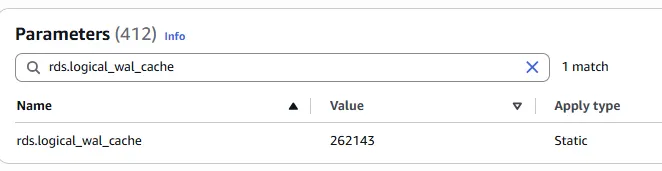
To the second one add parameter rds.logical_wal_cache = 262143
Two Aurora clusters with “defaultlogical” parameter group:
Create the ‘LongRunning’ script, which we will use to perform UPDATES on our database:
cat > LongRunning.sql <<EOF
-- We pick a random starting ID in a large table.
-- Then we update 50,000 rows at once, which is enough to generate WAL,
-- but small enough to finish quickly.
\set startid random(1, 49500000)
BEGIN;
UPDATE logicalrep
SET col1 = col1 + 1
WHERE id BETWEEN :startid AND (:startid + 50000);
COMMIT;
EOF
Create database:
psql
create database dblogicalrep;
\q
Both cluster have logical_replication = on:
show rds.logical_replication;
 rds.logical_replication
-------------------------
 on
(1 row)
Create your Tables on both clusters. We need to do this in order to setup your pub and sub connection:
CREATE TABLE logicalrep (
    id SERIAL PRIMARY KEY,
    col1 INT DEFAULT 0,
    filler TEXT
);
ALTER TABLE logicalrep SET (autovacuum_enabled = false);
Creating publication and subscription:
create publication mypub for all tables;
CREATE PUBLICATION
CREATE SUBSCRIPTION mysub CONNECTION
'host=${PGHOST} port=5432 dbname=dblogicalrep user=${PGUSER} password=${PGPASSWORD}'
PUBLICATION mypub;

NOTICE:  created replication slot "mysub" on publisher
CREATE SUBSCRIPTION
Check spill_bytes, replication_lag_bytes, and cache hit rate when we publisher starts replication.
psql
SELECT slot_name,
slot_name,
spill_txns,
spill_count,
spill_bytes
FROM pg_stat_replication_slots;
\watch 5
psql
SELECT slot_name,
pg_wal_lsn_diff(pg_current_wal_lsn(), confirmed_flush_lsn) AS replication_lag_bytes
FROM pg_replication_slots;
\watch 5
psql
SELECT * FROM aurora_stat_reset_wal_cache(NULL);
SELECT * FROM aurora_stat_logical_wal_cache();
\watch 5
Before we run our UPDATE script let us insert data into our table and allow the replication process to take place:
psql
-- Insert 50 million rows
-- (WARNING: This is very large and time-consuming)
INSERT INTO logicalrep (col1, filler)
SELECT
 (RANDOM() * 1000000)::INT,
 repeat('X', 200) -- 200 chars for a bigger row
FROM generate_series(1, 50000000);
This query will insert 50 million rows and these rows will then have to be replicated to your subscriber, the time should take about 30 minutes.
Replication lag is increasing:
Thu 02 Oct 2025 08:28:59 AM UTC (every 5s)

 slot_name | replication_lag_bytes
-----------+-----------------------
 mysub     |             504576184
(1 row)

Thu 02 Oct 2025 08:29:04 AM UTC (every 5s)

 slot_name | replication_lag_bytes
-----------+-----------------------
 mysub     |             504577912
(1 row)

Thu 02 Oct 2025 08:29:09 AM UTC (every 5s)

 slot_name | replication_lag_bytes
-----------+-----------------------
 mysub     |             504578968
(1 row)
 slot_name | slot_name | spill_txns | spill_count | spill_bytes
-----------+-----------+------------+-------------+-------------
 mysub     | mysub     |          1 |         254 | 17000002268
 name  | active_pid | cache_hit | cache_miss | blks_read | hit_rate |     last_reset_timestamp
-------+------------+-----------+------------+-----------+----------+-------------------------------
 mysub |       1015 |      2191 |    1663014 |   1665205 | 0.13%    | 2025-10-02 08:17:02.366303+00
Once the INSERT is finished we wait ~15 minutes till the replication lag becomes 0:
slot_name | replication_lag_bytes
-----------+-----------------------
 mysub     |             232805440
(1 row)

Thu 02 Oct 2025 08:45:20 AM UTC (every 5s)

 slot_name | replication_lag_bytes
-----------+-----------------------
 mysub     |             178961176
(1 row)

Thu 02 Oct 2025 08:45:25 AM UTC (every 5s)

 slot_name | replication_lag_bytes
-----------+-----------------------
 mysub     |             125117032
(1 row)

Thu 02 Oct 2025 08:45:30 AM UTC (every 5s)

 slot_name | replication_lag_bytes
-----------+-----------------------
 mysub     |              17427496
(1 row)

Thu 02 Oct 2025 08:45:35 AM UTC (every 5s)

 slot_name | replication_lag_bytes
-----------+-----------------------
 mysub     |                     0
(1 row)
Reboot the publisher instance to clear the stats in pg_stat_replication_slots view. After reboot:
SELECT slot_name,
slot_name,
spill_txns,
spill_count,
spill_bytes
FROM pg_stat_replication_slots;
 slot_name | slot_name | spill_txns | spill_count | spill_bytes
-----------+-----------+------------+-------------+-------------
 mysub     | mysub     |          0 |           0 |           0
(1 row)
Run the script below to observe the spill_bytes, replication lag and hit_rate:
date && pgbench -n -T 60 -P 5 -c 100 -j 10 -f LongRunning.sql dblogicalrep && date


Thu Oct  2 08:51:41 UTC 2025                        <-----
pgbench (14.19, server 15.5)
progress: 5.0 s, 0.0 tps, lat 0.000 ms stddev 0.000
progress: 10.0 s, 0.0 tps, lat 0.000 ms stddev 0.000
progress: 15.0 s, 0.0 tps, lat 0.000 ms stddev 0.000
progress: 20.0 s, 0.0 tps, lat 0.000 ms stddev 0.000
progress: 25.0 s, 0.0 tps, lat 0.000 ms stddev 0.000
progress: 30.0 s, 0.0 tps, lat 0.000 ms stddev 0.000
progress: 35.0 s, 0.6 tps, lat 34286.104 ms stddev 104.909
progress: 40.0 s, 17.0 tps, lat 36574.386 ms stddev 796.103
progress: 45.0 s, 0.2 tps, lat 44036.847 ms stddev NaN
progress: 50.0 s, 0.2 tps, lat 48933.299 ms stddev 0.003
progress: 55.0 s, 0.0 tps, lat 0.000 ms stddev 0.000
progress: 60.0 s, 0.2 tps, lat 58807.257 ms stddev NaN
progress: 65.0 s, 0.6 tps, lat 61406.092 ms stddev 1357.668
progress: 70.0 s, 1.2 tps, lat 39437.192 ms stddev 13253.666
transaction type: LongRunning.sql
scaling factor: 1
query mode: simple
number of clients: 100
number of threads: 10
duration: 60 s
number of transactions actually processed: 191
latency average = 37520.593 ms
latency stddev = 7554.613 ms
initial connection time = 341.758 ms
tps = 2.571231 (without initial connection time)
Thu Oct  2 08:52:56 UTC 2025                          <-----
The script was running for 75 seconds
Thu 02 Oct 2025 08:52:56 AM UTC (every 5s)

 slot_name | replication_lag_bytes
-----------+-----------------------
 mysub     |            2655989752
(1 row)

........................................
Thu 02 Oct 2025 08:59:32 AM UTC (every 5s)

 slot_name | replication_lag_bytes
-----------+-----------------------
 mysub     |               6991968
(1 row)

Thu 02 Oct 2025 08:59:37 AM UTC (every 5s)

 slot_name | replication_lag_bytes
-----------+-----------------------
 mysub     |                     0
(1 row)
And 7 minutes more for replication lag to become = 0
hit_rate measures how efficiently the system is reusing previously cached wal pages during logical decoding:
 name  | active_pid | cache_hit | cache_miss | blks_read | hit_rate |     last_reset_timestamp
-------+------------+-----------+------------+-----------+----------+-------------------------------
 mysub |        638 |      2398 |     344058 |    346456 | 0.69%    | 2025-10-02 08:51:20.275374+00
(1 row)
Spill_bytes shows us that our logical_decoding_work_mem could use improvement:
 slot_name | slot_name | spill_txns | spill_count | spill_bytes
-----------+-----------+------------+-------------+-------------
 mysub     | mysub     |        190 |        2349 |  3230087964
(1 row)
How to resolve
Performance drop was due to logical replication parameters not being tuned correctly.
Aurora PostgreSQL uses write-through cache to boost logical replication performance. Without this cache, Aurora relies heavily on its storage layer for the native PostgreSQL replication process. The write-through cache reduces disk access by buffering the logical WAL stream, minimizing repeated reads and writes to storage.
This buffer corresponds to PostgreSQL’s native logical replication cache and is controlled by the rds.logical_wal_cache parameter. By default, it is set to 16 MB (measured in 8 KB blocks). In our modified cluster parameter group, this has already been increased to 262,143 blocks (~2 GB).
Apply this configuration to the publisher cluster and reboot it:
Repeat the test again:
date && pgbench -n -T 60 -P 5 -c 100 -j 10 -f LongRunning.sql dblogicalrep && date


Thu Oct  2 09:25:42 UTC 2025                            <--------
pgbench (14.19, server 15.5)
progress: 5.0 s, 0.0 tps, lat 0.000 ms stddev 0.000
progress: 10.0 s, 0.0 tps, lat 0.000 ms stddev 0.000
progress: 15.0 s, 0.0 tps, lat 0.000 ms stddev 0.000
progress: 20.0 s, 0.0 tps, lat 0.000 ms stddev 0.000
progress: 25.0 s, 0.0 tps, lat 0.000 ms stddev 0.000
progress: 30.0 s, 0.0 tps, lat 0.000 ms stddev 0.000
progress: 35.0 s, 0.0 tps, lat 0.000 ms stddev 0.000
progress: 40.0 s, 3.4 tps, lat 38262.565 ms stddev 452.218
progress: 45.0 s, 15.6 tps, lat 40121.185 ms stddev 719.123
progress: 50.0 s, 0.0 tps, lat 0.000 ms stddev 0.000
progress: 55.0 s, 0.0 tps, lat 0.000 ms stddev 0.000
progress: 60.0 s, 0.0 tps, lat 0.000 ms stddev 0.000
progress: 65.0 s, 0.0 tps, lat 0.000 ms stddev 0.000
progress: 70.0 s, 0.0 tps, lat 0.000 ms stddev 0.000
progress: 75.0 s, 0.6 tps, lat 48293.690 ms stddev 18135.596
progress: 80.0 s, 3.6 tps, lat 42731.243 ms stddev 12591.065
transaction type: LongRunning.sql
scaling factor: 1
query mode: simple
number of clients: 100
number of threads: 10
duration: 60 s
number of transactions actually processed: 195
latency average = 41131.672 ms
latency stddev = 6300.691 ms
initial connection time = 529.490 ms
tps = 2.356357 (without initial connection time)
Thu Oct  2 09:27:06 UTC 2025                           <--------
Below is the main difference is now we see a 100% hit_rate as opposed to our previous run where we saw a 0.69% hit_rate. That is a significant increase and is the primary reason that we see replication time go down.
 name  | active_pid | cache_hit | cache_miss | blks_read | hit_rate |     last_reset_timestamp
-------+------------+-----------+------------+-----------+----------+-------------------------------
 mysub |        631 |     10233 |          0 |     10233 | 100.00%  | 2025-10-02 09:26:25.023437+00
Thu
Thu 02 Oct 2025 09:32:36 AM UTC (every 5s)

 slot_name | replication_lag_bytes
-----------+-----------------------
 mysub     |              31461416
(1 row)

Thu 02 Oct 2025 09:32:41 AM UTC (every 5s)

 slot_name | replication_lag_bytes
-----------+-----------------------
 mysub     |               5430952
(1 row)

Thu 02 Oct 2025 09:32:46 AM UTC (every 5s)                  <--------

 slot_name | replication_lag_bytes
-----------+-----------------------
 mysub     |                     0
(1 row)
5 minutes for replication lag to become = 0
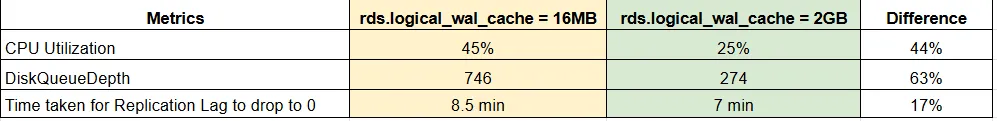
Differences beween runs:
Conclusions
We optimized our logical replication workload, compared results across test runs, and demonstrated the benefits of tuning the rds.logical_wal_cache parameter.
In two additional runs, we observed that setting logical_decoding_work_mem = 2GB reduced replication lag clearance time by 1.5 min (from 8.5 min to 7 min).
Long-running transactions on the publisher side can significantly increase replication lag on the subscriber. Properly tuning replication parameters helps reduce this lag, while continuous monitoring is key to understanding and improving the performance of logical replication.