
Welcome to a three-part blog series explaining the most common scenarios involving performance issues for Amazon Aurora PostgreSQL.
Each use case includes sections to demonstrate the performance issue, as well as a process to analyze, identify, and resolve it. This is Part 1, which includes:
- Impact of idle connections
- Impact of MultiXacts
- Low system memory due to query memory consumption
Impact of idle connections
PostgreSQL uses a process-per-user client/server architecture. In this design, each client process communicates with a single dedicated backend process. The backend process reserves memory for activities such as connection handling, caching, and query execution.
After a query or transaction finishes, some of this memory — like that used for sorting or query execution — is released. However, other reusable structures, including prepared statements, cached execution plans, and metadata caches, are kept to avoid the overhead of repeatedly allocating and deallocating them.
It’s essential to note that “idle connections don’t consume resources” is incorrect. As long as a connection remains open, its backend process continues to hold allocated memory, even when idle. A buildup of idle connections is a frequent source of degraded database performance.
Problem
Our Aurora PostgreSQL environment is low on memory. We have a low-volume, read-only workload running on the system. How can we find out what is consuming the memory?
How to simulate
Connect to your PostgreSQL and create a new database:
psql
 Create database dbconnection;
 \c dbconnection
 \q
Generate sample data for the use case. pgbench is a simple program for running benchmark tests on PostgreSQL:
pgbench -i --fillfactor=100 --scale=100 dbconnection

  psql
  SELECT pg_size_pretty(pg_database_size('dbconnection'));
  \q
Run a light read-only workload:
pgbench --progress-timestamp -n -T 600 -P 5 -c 1000 -R 100 -b select-only dbconnection
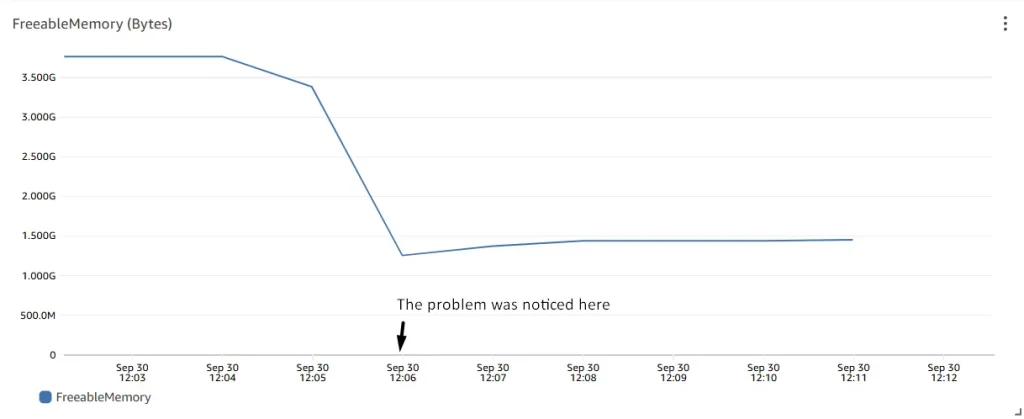
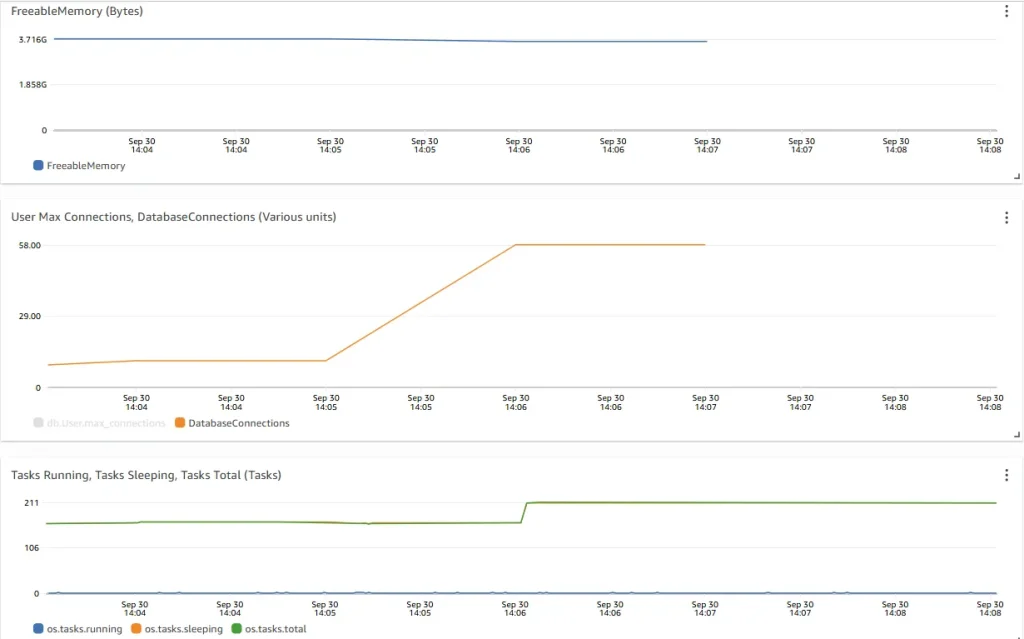
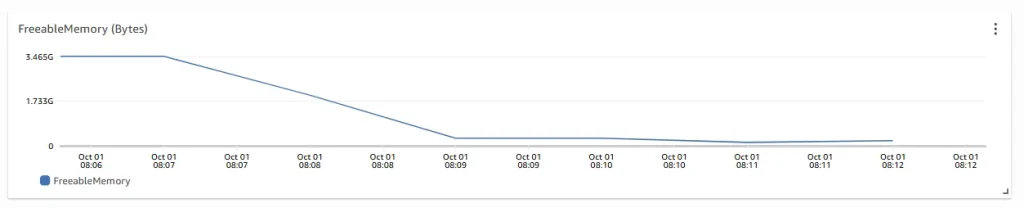
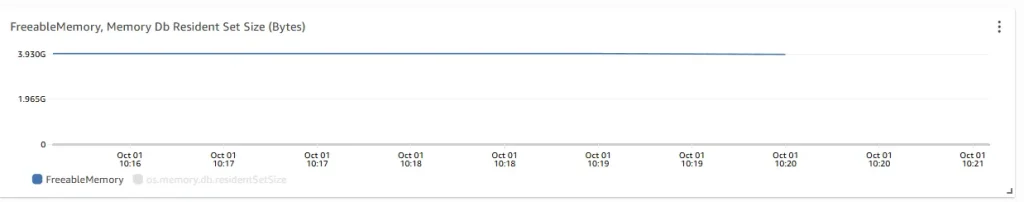
Observe the behaviors of freeable memory during the problematic period. Freeable memory was at ~3.75 GB before, but dropped down and stabilized at ~1.4 GB. About ~2.35 GB of memory was consumed.
Analysis
Review database configuration settings:
PostgreSQL memory can be classified into global shared memory and local process memory. Key factors impacting memory usage could be due to
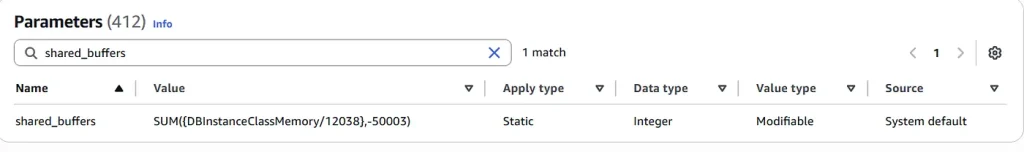
Overallocation of shared_buffers. This parameter determines the global memory size (in 8K) to use for PostgreSQL data page cache. The Aurora PostgreSQL default is set to SUM(DBInstanceClassMemory/12038,-50003)
- Overallocation of work_mem.
This parameter determines the amount of memory used for per sort (e.g., order by, distinct), or hash/merge join operation. PostgreSQL default is 4096 KB. Total work_mem allocation is affected by the number of sort/hash operations in the query and the number of connections executing the query. - Overallocation of maintenance_work_mem.
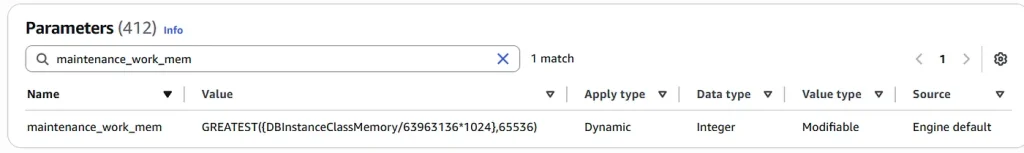
This parameter determines the maximum amount of memory used for each maintenance worker, such as vacuum (if autovacuum_work_mem is not set), index build. Aurora PostgreSQL default is set to GREATEST(DBInstanceClassMemory/63963136*1024,65536)
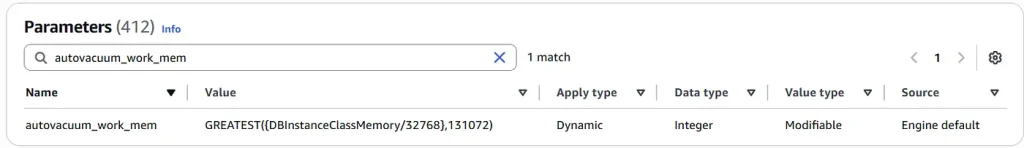
- Overallocation of autovacuum_work_mem. This parameter determines the maximum memory to be used by each autovacuum worker process. Aurora PostgreSQL default is set to GREATEST(DBInstanceClassMemory/32768,131072)
- Overallocation of logical_decoding_work_mem.
This parameter determines the maximum amount of memory (in KB) that can be used by each internal reordering buffer before spilling to disk. PostgreSQL default is 65536 KB. This is applicable if logical replication is enabled. - Queries consuming a large amount of memory.
- High number of connections. Each open connection consumes local process memory.
Check the list of key memory-related configuration settings. Review the setting column for any custom values that could potentially cause memory overallocation.
SELECT name, setting, unit, boot_val, reset_val FROM pg_settings
  WHERE name in (
      'shared_buffers',
      'work_mem',
      'maintenance_work_mem',
      'autovacuum_work_mem',
      'logical_decoding_work_mem'
  );

           name            | setting | unit | boot_val | reset_val
---------------------------+---------+------+----------+-----------
 autovacuum_work_mem       | 499400  | kB   | -1       | 499400
 logical_decoding_work_mem | 65536   | kB   | 65536    | 65536
 maintenance_work_mem      | 261120  | kB   | 65536    | 261120
 shared_buffers            | 1309388 | 8kB  | 16384    | 1309388
 work_mem                  | 4096    | kB   | 4096     | 4096
(5 rows)
Review query memory usage:
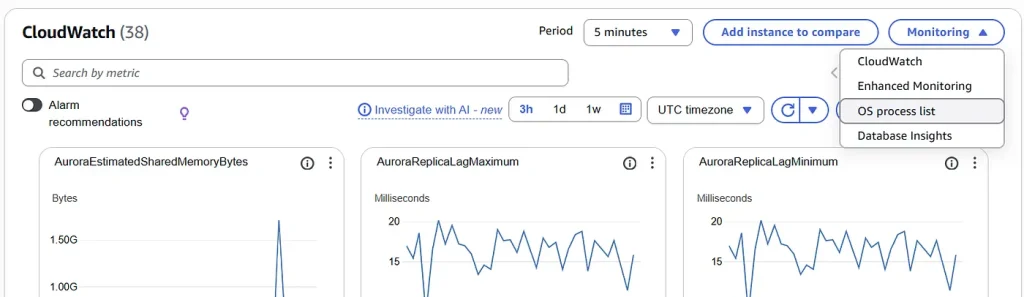
Open Enhanced Monitoring to monitor PostgreSQL processes. From the Monitoring dropdown, select OS process list.
Enhanced Monitoring shows process information for
- OS processes. This shows a summary of the kernel and system processes, which generally have minimal impact on performance.
- RDS processes. This shows a summary of the resources used by the RDS management agent, diagnostics monitoring processes, and other AWS processes that are required to support RDS DB instances.
- Aurora PostgreSQL system processes. For example, Aurora Storage Daemon, walwriter.
- Aurora PostgreSQL user processes.
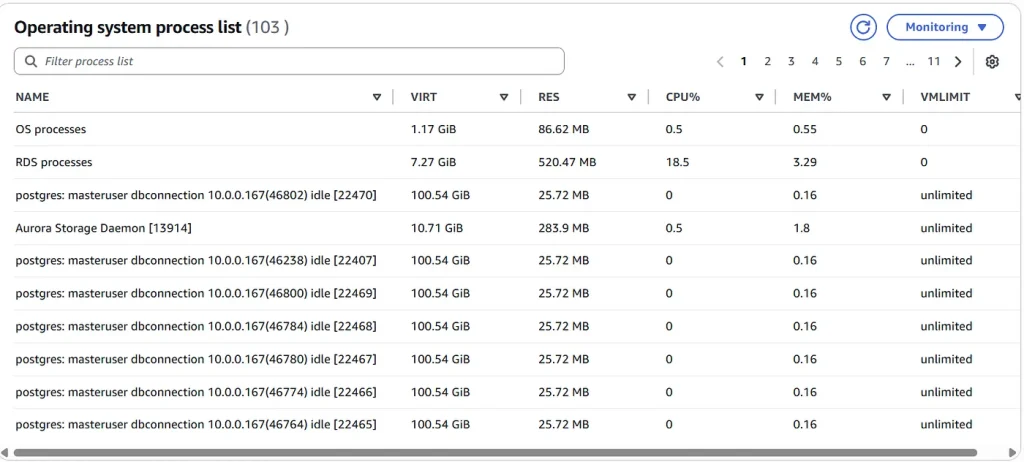
The detail resource utilization for each process are shown:
- VIRT displays the virtual size of the process.
- RES displays the actual physical memory being used by the process.
- CPU% displays the percentage of the total CPU bandwidth being used by the process.
- MEM% displays the percentage of the total memory being used by the process.
Review connection memory usage:
Create 3 widgets in Performance Insights:
Widget 1: FreeableMemory
Widget 2: Max Connections / DatabaseConnections
Widget 3: Tasks Total / Tasks Running / Tasks Sleeping
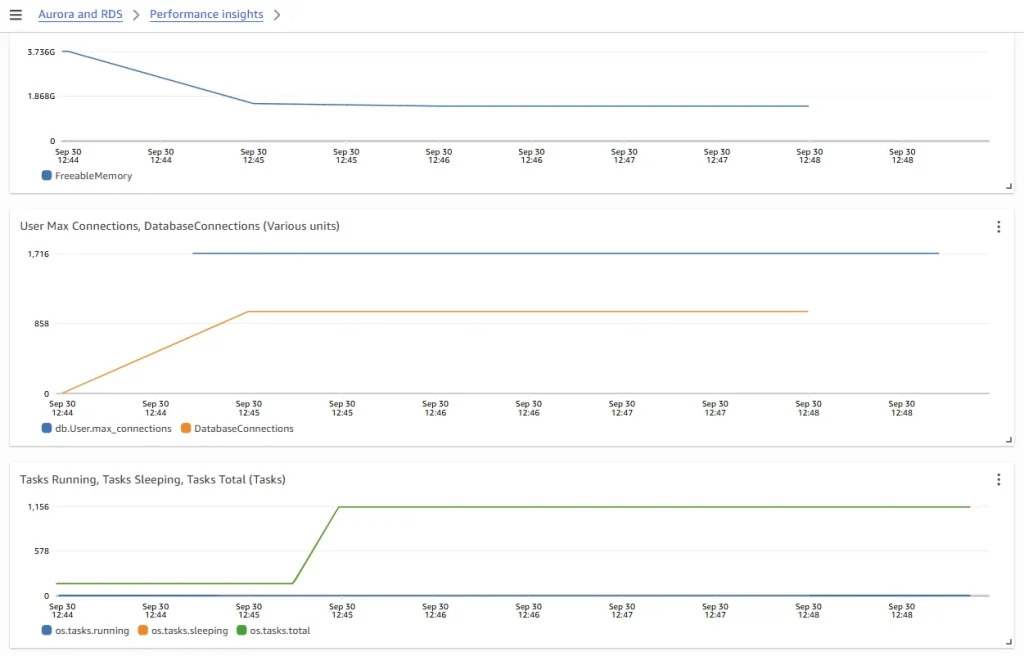
From the dashboard, observe the followings
1. There are 1000 connections opened. Although the number of connections are within the max connections setting, the 500:1 connection vs. vCPU ratio is way too high for the provisioned r6g.large database instance with 2 vCPUs.
SELECT name, setting, unit, boot_val, reset_val FROM pg_settings
  WHERE name = 'max_connections';
      name       | setting | unit | boot_val | reset_val
-----------------+---------+------+----------+-----------
 max_connections | 1716    |      | 100      | 1716
(1 row)
2. Reviewing metrics for OS Tasks Total vs. Running vs. Sleeping, we can see that almost 100% of the tasks are sleeping. All 1000 database connections are sitting in idle state in majority of the time.
3. The FreeableMemory drop as the number of database connections increases. Once the number of database connections stablized at 1000, the FreeableMemory dropping trend also stops.
How to resolve
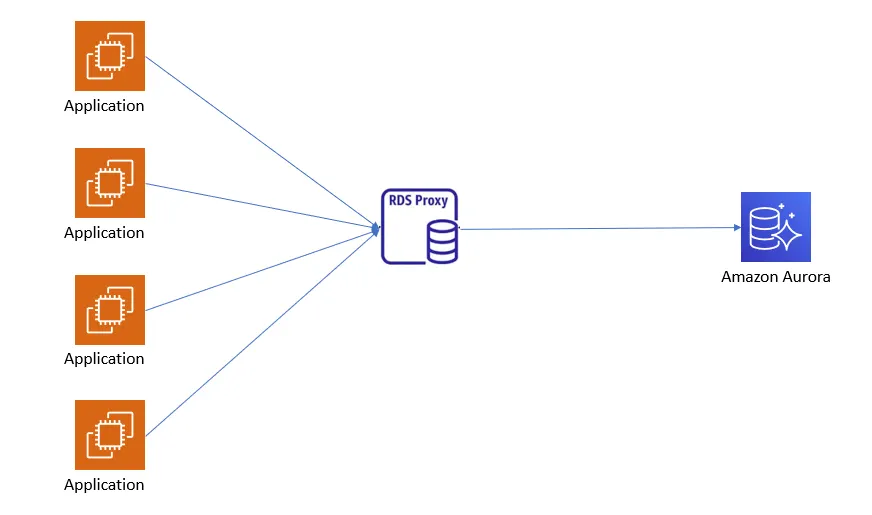
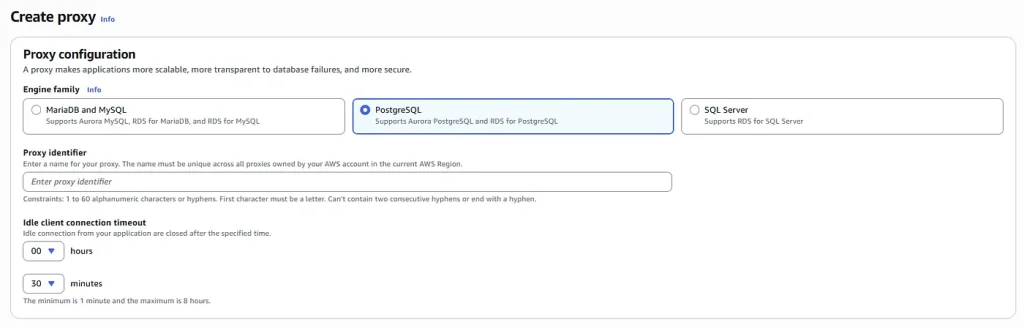
To minimize the overhead of repeatedly opening and closing database connections and to reduce resource usage, applications often use client-side or external server-side connection poolers. In PostgreSQL, each connection, idle or active, consumes about 2–10 MB of memory depending on the version. Without properly configuring the max_connections parameter, applications risk opening more connections than the system can handle, which may lead to query cancellations or even downtime. Using external poolers such as PgBouncer, PgPool II, or RDS Proxy is recommended, as they provide centralized server-side pooling, reduce memory consumption, and improve connection sharing across all application servers.
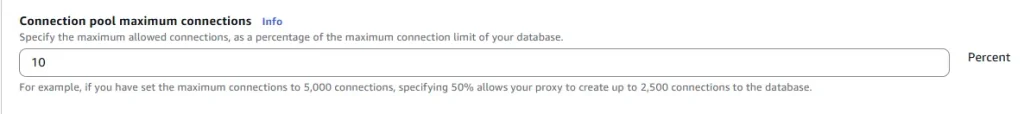
Connection pool maximum connections will be 10. This defines the maximum number of connections that the proxy can make on the database, as a percentage of the max_connections parameter value of the target DB instance. For r6g.large database instance deployed in this use case, the default max_connections is set to LEAST(DBInstanceClassMemory/9531392,5000), that is 1716.
Test
PROXYENDP=aupg-labs-proxy.proxy-cx8wiqowm1we.eu-west-1.rds.amazonaws.com

pgbench --progress-timestamp -n -T 600 -P 5 -c 1000 -R 100 -h $PROXYENDP -b select-only dbconnection
RDS Proxy metrics:
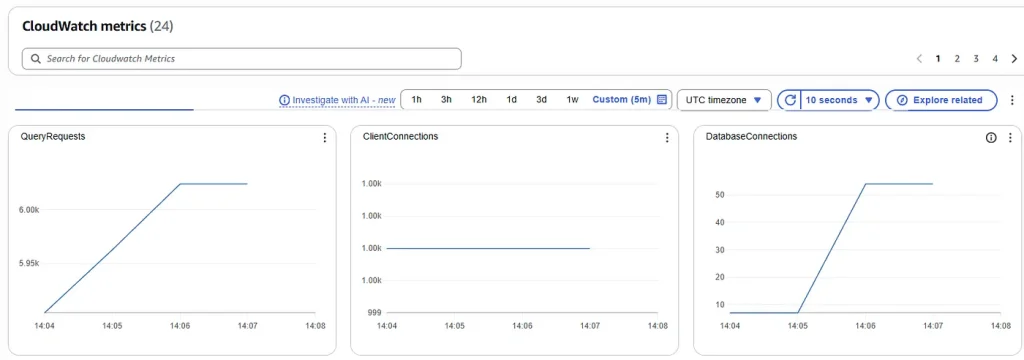
Aurora metrics:
- To serve 1000 client connections, the number of actual physical database connections used by RDS Proxy is less than 60.
- There is less than 100 MB memory drop of FreeableMemory. There is a significant savings in memory comparing to 2.35 GB drop of FreeableMemory without using RDS Proxy.
- The number of Tasks Running is < 1, which indicates connections are sitting in idle state most of the time. There are opportunity to further reduce RDS Proxy connection pool size.
Conclusions
- When applications use client-side connection pooling and scale across many servers, they can create an excessive number of database connections.
- Even idle connections continue to consume memory.
- A server-side connection pooler is more efficient, as it enables connection multiplexing and reduces overall database resource usage.
Impacts of MultiXacts
PostgreSQL ensures data consistency under concurrent access through its locking mechanisms, with a strong focus on row-level locks. When multiple transactions try to lock the same row at once, PostgreSQL uses a specialized structure known as MultiXact IDs. These allow several locks on a single row to be managed efficiently. However, while effective, MultiXacts can also create performance issues, including unexpected slowdowns and delays during vacuum processes.
Problem
- Aurora PostgreSQL environment is experiencing performance degradation.
- Database appears to be stalled.
- CPU, DBLoad, BufferCacheHitRatio appear healthy
Symptoms
- Slow running queries
- Application requests timeouts
How to simulate
Connect to your PostgreSQL server and create a database:
psql
Create database dbmultixact;
\c dbmultixact
\q
Generate sample dataset:
  psql -d dbmultixact
  CREATE TABLE locations (
  loc_id integer NOT NULL PRIMARY KEY,
  loc_name text,
  filler text
  );

  CREATE TABLE users (
  id SERIAL PRIMARY KEY,
  loc_id integer REFERENCES locations(loc_id),
  fname text
  );
\q
psql -d dbmultixact
INSERT INTO locations VALUES (1,'New York','Test1-filler');
INSERT INTO locations VALUES (2,'Los Angeles','Test2-filler');
INSERT INTO locations VALUES (3,'Washington DC','Test3-filler');
INSERT INTO locations VALUES (4,'Seattle','Test4-filler');
INSERT INTO locations VALUES (5,'Houston','Test5-filler');
\q
The following code will generate few sql scripts. The scripts will be used to generate MultiXactIDs, running update on the locations table on couple of loc_id’s and running concurrent inserts into the users table using the same foreign key id.
echo "begin;" > mxact_update.sql
echo "update locations set loc_name = 'junk-001' where loc_id  in (1,2) ;" >> mxact_update.sql
echo "select pg_sleep(1);" >> mxact_update.sql
echo "commit;" >> mxact_update.sql
echo "begin;" > mxact_inserts_1.sql
echo "INSERT INTO users (loc_id, fname) VALUES (1,'Testing User-1-001');" >>mxact_inserts_1.sql
echo "commit;" >> mxact_inserts_1.sql
echo "begin;" > mxact_inserts_2.sql
echo "INSERT INTO users (loc_id, fname) VALUES (2,'Testing User-2-002');" >> mxact_inserts_2.sql
echo "commit;" >> mxact_inserts_2.sql
$ ls
mxact_inserts_1.sql  mxact_inserts_2.sql  mxact_update.sql
$ cat mxact_inserts_1.sql
begin;
INSERT INTO users (loc_id, fname) VALUES (1,'Testing User-1-001');
commit;

$ cat mxact_inserts_2.sql
begin;
INSERT INTO users (loc_id, fname) VALUES (2,'Testing User-2-002');
commit;

$ cat mxact_update.sql
begin;
update locations set loc_name = 'junk-001' where loc_id  in (1,2) ;
select pg_sleep(1);
commit;
To monitor the MultiXact locking behavior, lets install the pgrowlocks extension in the database.
psql -d dbmultixact
CREATE EXTENSION pgrowlocks;
\q
Run a pgbench workload to generate the load on the database (3 terminals in parallel):
pgbench --progress-timestamp -M prepared -n -T 600 -P 5 -c 100 -f mxact_update.sql dbmultixact --no-vacuum
pgbench --progress-timestamp -M prepared -n -T 600 -P 5 -c 200 -f mxact_inserts_1.sql dbmultixact --no-vacuum
pgbench --progress-timestamp -M prepared -n -T 600 -P 5 -c 200 -f mxact_inserts_2.sql dbmultixact --no-vacuum
The result of script execution will look like this:
$ pgbench --progress-timestamp -M prepared -n -T 600 -P 5 -c 100 -f mxact_update.sql dbmultixact --no-vacuum
pgbench (14.19, server 15.5)
progress: 1759253210.006 s, 0.0 tps, lat 0.000 ms stddev 0.000
progress: 1759253212.891 s, 0.7 tps, lat 1270.685 ms stddev 143.827
progress: 1759253217.892 s, 0.8 tps, lat 3150.769 ms stddev 1801.162
progress: 1759253222.902 s, 0.8 tps, lat 7699.548 ms stddev 3406.406
..................................................
progress: 1759253292.894 s, 0.2 tps, lat 79762.321 ms stddev NaN
progress: 1759253297.894 s, 0.2 tps, lat 84706.646 ms stddev 0.001
progress: 1759253302.892 s, 0.4 tps, lat 72199.898 ms stddev 16957.979
progress: 1759253307.891 s, 0.2 tps, lat 94226.173 ms stddev NaN
progress: 1759253312.891 s, 0.6 tps, lat 100719.218 ms stddev 1627.898
progress: 1759253317.894 s, 0.2 tps, lat 54421.260 ms stddev 0.000
................................................

transaction type: mxact_update.sql
scaling factor: 1
query mode: prepared
number of clients: 100
number of threads: 1
duration: 600 s
number of transactions actually processed: 258      <- we will need this
latency average = 254121.165 ms                     <- and this
latency stddev = 225785.490 ms
initial connection time = 7041.043 ms
tps = 0.360042 (without initial connection time)    <- and this
Analysis
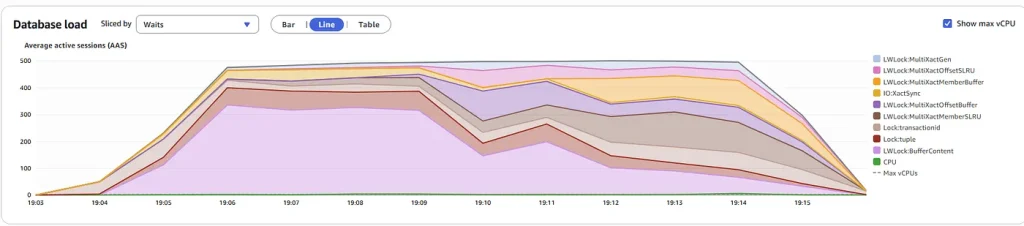
We’ve observed that the Aurora cluster is running slowly despite normal system resource usage (CPU, memory, and disk). This performance degradation is likely tied to waits and queues within PostgreSQL’s internal structures. A high volume of generated MultiXact IDs should be a primary focus of our investigation.
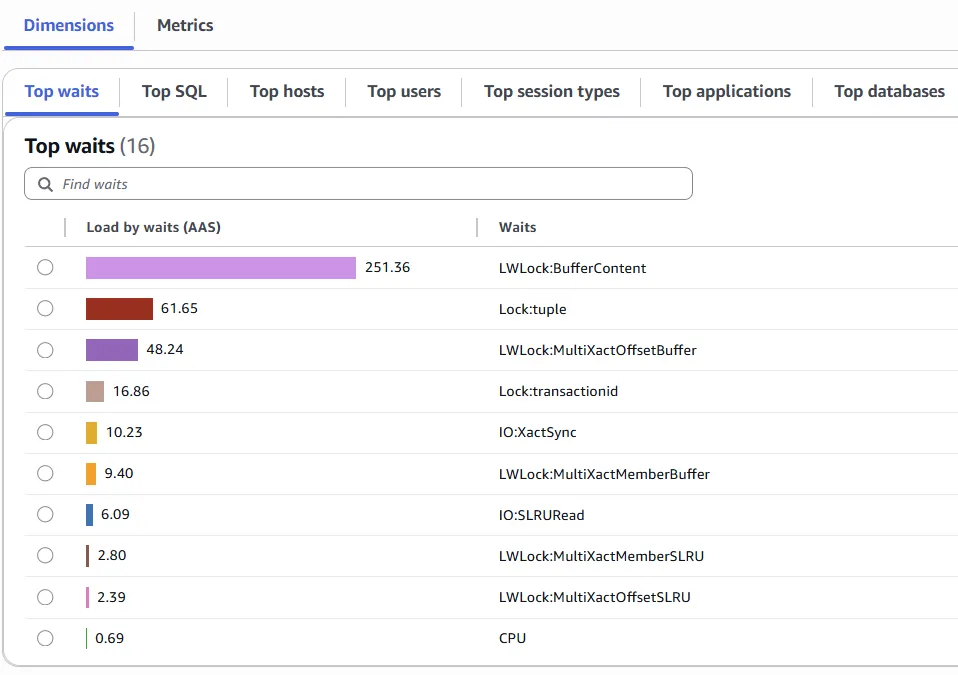
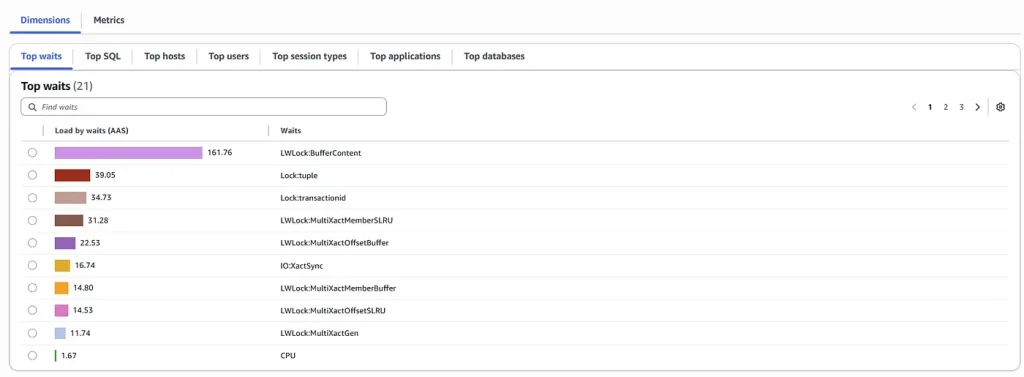
Monitor Waits in Performance Insights:
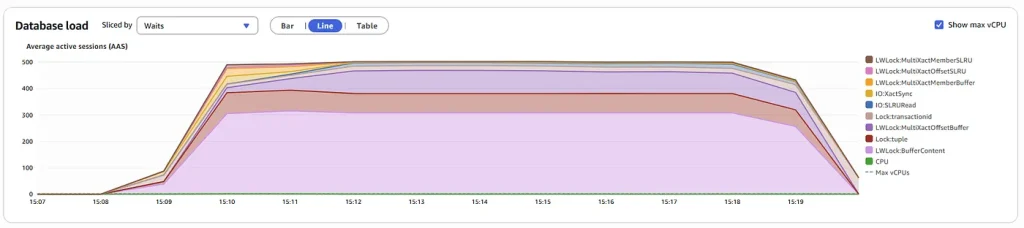
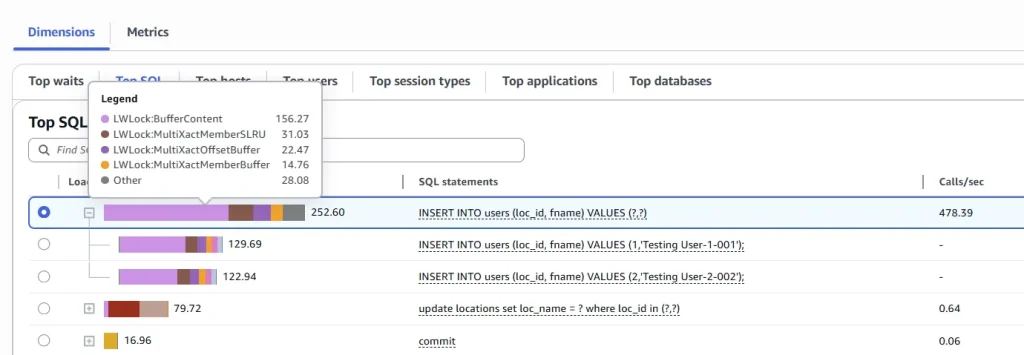
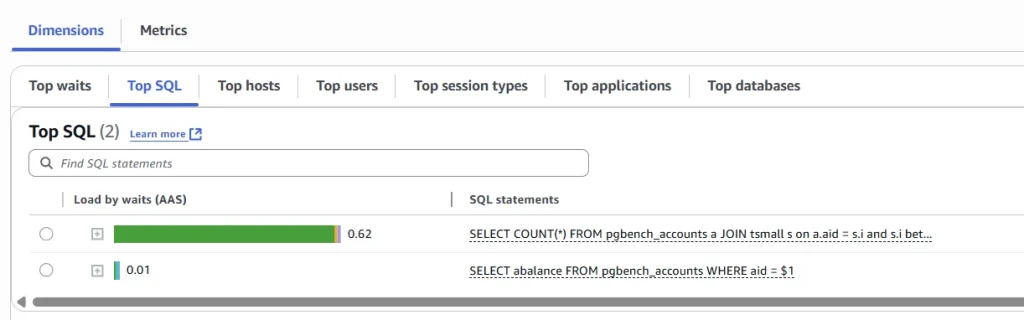
Database workload activity is using the MultiXact mechanism heavily:
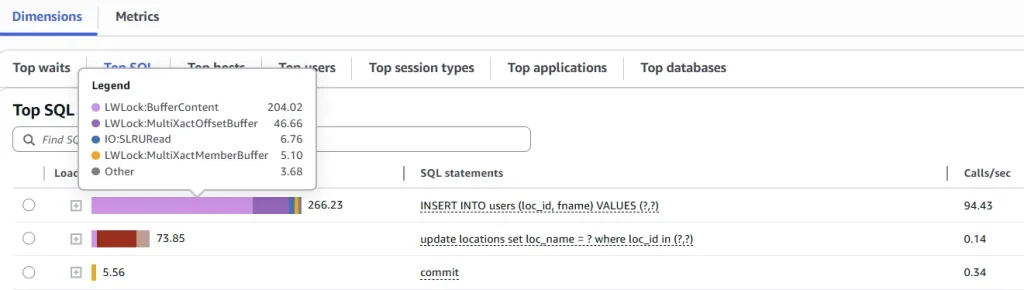
The INSERT operations are the Top SQL generating the MultiXacts.
The main wait event we are interested is below:
- The LWLock:BufferContent event occurs when a session is waiting to read or write a data page in memory while another session has that page locked for writing.
- The LWLock:MultiXactOffsetBuffer a process is waiting for I/O on a simple least-recently used (SLRU) buffer for a multixact offset.
- The LWLock:MultiXactMemberBuffer a process is waiting for I/O on a simple least-recently used (SLRU) buffer for a multixact member.
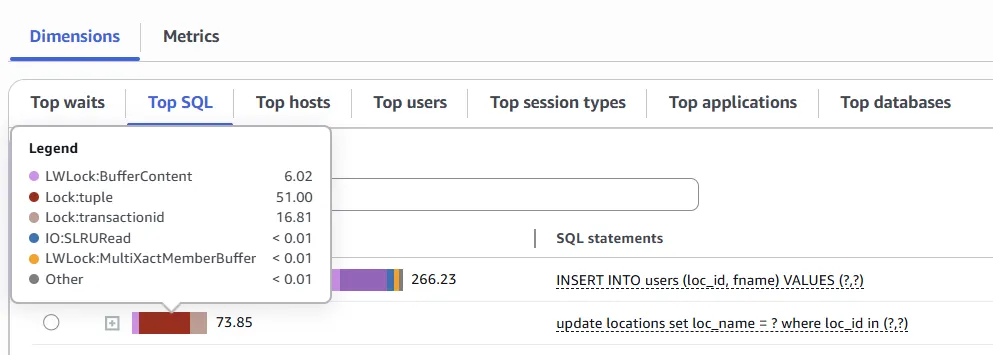
The Lock:transactionid event occurs when a transaction is waiting for a row-level lock. The session that shows the Lock:transactionid wait event is blocked because of this lock. After the blocking transaction ends in either a COMMIT or ROLLBACK statement, the blocked transaction can proceed.
The Lock:BufferContent event occurs when a session is waiting to read or write a data page in memory while another session has that page locked for writing.
The Lock:tuple event occurs when a backend process is waiting to acquire a lock on a tuple.
psql -d dbmultixact
select * from pg_stat_slru WHERE name in ('MultiXactMember','MultiXactOffset');
\q


      name       | blks_zeroed | blks_hit | blks_read | blks_written | blks_exists | flushes | truncates |          stats_reset
-----------------+-------------+----------+-----------+--------------+-------------+---------+-----------+-------------------------------
 MultiXactMember |        9034 |  4887286 |   1586171 |            0 |           0 |       0 |         0 | 2025-09-29 13:03:58.688907+00
 MultiXactOffset |         153 |  4832971 |   1583930 |            0 |           0 |       0 |         0 | 2025-09-29 13:03:58.688907+00
(2 rows)
Here we see under (blks_read — № of SLRU pages read from the disk ) that almost 1.6 million number of disk blocks were read for MultiXactMember and more than 1.5M for MultiXactOffset.
psql -d dbmultixact

SELECT locked_row, locker, multi, array_length(xids,1) NumberOfXids FROM pgrowlocks('locations');
 locked_row | locker | multi | numberofxids
------------+--------+-------+--------------
 (2,53)     | 323100 | t     |           31
 (2,54)     | 323104 | t     |           36
(2 rows)
Locker column is represented by the transaction ID locking the row, column multi is true which means it is a multitransaction and NumberOfXids captures the № of MultiXactIDs generated for each of the transaction IDs.
How to resolve
In PostgreSQL, row-level locks store the transaction ID (XID) in the row’s XMAX field during operations like UPDATE or DELETE. These locks block conflicting writes but not reads and persist until the transaction ends or a savepoint is rolled back. When multiple transactions need to lock the same row, PostgreSQL uses a MultiXact ID, a structure that efficiently tracks several locks on one row. MultiXacts can also arise from SELECT … FOR SHARE, sub-transactions created by savepoints or EXCEPTION blocks, and certain drivers or ORMs that automatically add savepoints.
Recommendations
- Run VACUUM FREEZE on the affected tables.
- Tune table-level settings to trigger autovacuum more aggressively for MultiXact cleanup.
- Increase memory settings to keep MultiXact structures in memory longer before spilling to disk.
- Minimize or avoid long-running transactions.
- Implement proactive monitoring of key metrics and leverage PostgreSQL tools to track MultiXact activity.
SELECT name, setting, unit, boot_val, reset_val FROM pg_settings
WHERE name in (
'multixact_members_cache_size',
'multixact_offsets_cache_size'
);
             name             | setting | unit | boot_val | reset_val
------------------------------+---------+------+----------+-----------
 multixact_members_cache_size | 16      |      | 16       | 16
 multixact_offsets_cache_size | 8       |      | 8        | 8
(2 rows)
You can optimize memory usage for MultiXact caches by tuning the parameters multixact_offsets_cache_size and multixact_members_cache_size. These settings define how much memory is reserved for the caches and can help reduce MultiXact wait events. Each cache entry consumes 8 KB of memory, so the total reserved memory is calculated as parameter value × 8 KB. For example, setting a parameter to 128 reserves about 1 MB.
AWS recommends configuring these parameters at the cluster level for consistency across all instances, testing different values to match your workload and instance class. A reboot of the writer instance is required for changes to take effect.
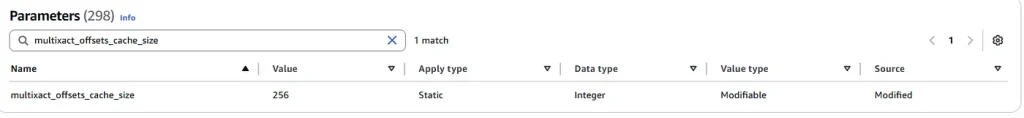
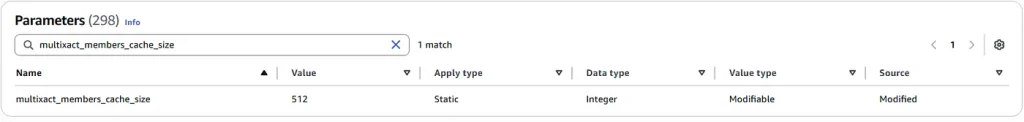
SELECT name, setting, unit, boot_val, reset_val FROM pg_settings
  WHERE name in (
      'multixact_members_cache_size',
      'multixact_offsets_cache_size'
  );
             name             | setting | unit | boot_val | reset_val
------------------------------+---------+------+----------+-----------
 multixact_members_cache_size | 512     |      | 16       | 512
 multixact_offsets_cache_size | 256     |      | 8        | 256
(2 rows)
Reset pg_stat_slru statistics before re-running the pgbench test
psql -d dbmultixact

SELECT pg_stat_reset_slru('MultiXactMember');
 pg_stat_reset_slru
--------------------

(1 row)

SELECT pg_stat_reset_slru('MultiXactOffset');
 pg_stat_reset_slru
--------------------

(1 row)

SELECT * FROM pg_stat_slru WHERE name in ('MultiXactMember','MultiXactOffset');
      name       | blks_zeroed | blks_hit | blks_read | blks_written | blks_exists | flushes | truncates |          stats_reset
-----------------+-------------+----------+-----------+--------------+-------------+---------+-----------+-------------------------------
 MultiXactMember |           0 |        0 |         0 |            0 |           0 |       0 |         0 | 2025-09-30 19:01:48.844204+00
 MultiXactOffset |           0 |        0 |         0 |            0 |           0 |       0 |         0 | 2025-09-30 19:01:48.845601+00
(2 rows)
Review statistics about access to MultiXact SLRU cached pages.
$ psql -d dbmultixact

dbmultixact=> select * from pg_stat_slru where name in ('MultiXactMember','MultiXactOffset');
      name       | blks_zeroed | blks_hit  | blks_read | blks_written | blks_exists | flushes | truncates |          stats_reset
-----------------+-------------+-----------+-----------+--------------+-------------+---------+-----------+-------------------------------
 MultiXactMember |       19359 | 100138923 |     73561 |            0 |           0 |       0 |         0 | 2025-09-30 19:01:48.844204+00
 MultiXactOffset |         445 | 100013003 |     95489 |            0 |           0 |       0 |         0 | 2025-09-30 19:01:48.845601+00
(2 rows)
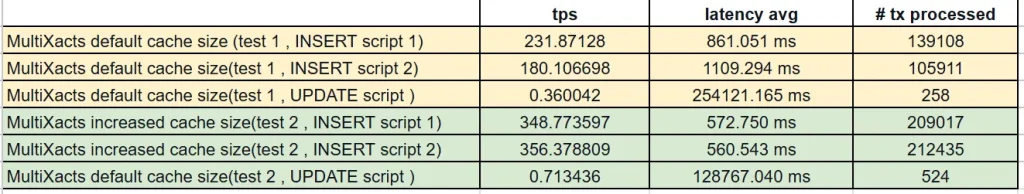
After we increased MultiXact memory cache parameters you can observe for MultiXactMember cache, more blks_hit ~ 100 million cache hit compared to ~5 million and less blks_read from disk ~ 73k compared to 1.5 Million
After minimizing the MultiXact generation, tps is higher and latency is lower.
Conclusions
- MultiXacts are special lock structures that can introduce performance and maintenance challenges.
- They occur when multiple transactions on a child table take shared locks on a parent row in a primary–foreign key relationship.
- Proactive measures — such as regular vacuuming, tuning memory settings, and avoiding long-running transactions — help mitigate the bottlenecks they create.
Low system memory due to query memory consumption
PostgreSQL allocates memory to queries on a per-query basis using parameters such as work_mem and maintenance_work_mem. A query’s lifecycle begins with the parser, which validates syntax before passing it to the rewriter, and then to the planner. The planner evaluates statistics and metadata to generate multiple execution plans with estimated costs, selecting the most efficient one. The executor then runs the query, returns results to the client, and caches the plan for reuse to avoid replanning overhead.
However, not all plans are optimal. In some cases, PostgreSQL may select inefficient joins or access methods (e.g., hash joins instead of nested loops), leading to excessive memory usage and degraded performance.
Problem
Our Aurora PostgreSQL cluster memory is dropping rapidly with less than 10 connections. This is an OLTP workload, we expect more users. However we are concerned about running out of memory when more users login.
Symptoms
- Freeable Memory dropped to below 5% within 10 minutes of workload startup
- Number of database connections is less than 10
How to simulate
Create a new database:
psql
Create database dbmem;
\c dbmem
\q
Generate sample dataset:
pgbench -i --fillfactor=100 --scale=100 dbmem

dropping old tables...
NOTICE:  table "pgbench_accounts" does not exist, skipping
NOTICE:  table "pgbench_branches" does not exist, skipping
NOTICE:  table "pgbench_history" does not exist, skipping
NOTICE:  table "pgbench_tellers" does not exist, skipping
creating tables...
generating data (client-side)...
10000000 of 10000000 tuples (100%) done (elapsed 17.04 s, remaining 0.00 s)
vacuuming...
creating primary keys...
done in 25.46 s (drop tables 0.00 s, create tables 0.02 s, client-side generate 17.68 s, vacuum 2.82 s, primary keys 4.95 s).
Once sample dataset is generated, you should see database size is ~1.5GB
SELECT pg_size_pretty(pg_database_size('dbmem'));
 pg_size_pretty
----------------
 1503 MB
(1 row)
Create a table “tsmall” in the above created database (dbmem) and insert sample data into it:
psql
\c dbmem
CREATE TABLE tsmall (i int);
INSERT INTO tsmall SELECT generate_series(1, 5000)::int i;
Now, assume that in this scenario, we have a short-lived table (tsmall) and we decide that it is a better option to disable the AUTOVACUUM setting on this specific table as the table is dropped frequently. Also, let’s update the table statistics and insert additional data into the same table:
ALTER TABLE tsmall SET (autovacuum_enabled = off);
ANALYZE tsmall;
INSERT INTO tsmall SELECT 42 FROM generate_series(1, 5000000);
\q
Run two workloads- A built-in and a custom script
echo "SELECT COUNT(*) FROM pgbench_accounts a JOIN tsmall s on a.aid = s.i and s.i between 30 and 20000;" > "highmem.sql"


cat highmem.sql
SELECT COUNT(*) FROM pgbench_accounts a JOIN tsmall s on a.aid = s.i and s.i between 30 and 20000;
Next, run a pgbench workload to generate a simulated workload, which runs the queries in the SQL scripts for a specified period. We will execute the custom user provided SQL script specified with -f as well as the built-in script specfied with -b :
pgbench --progress-timestamp -M prepared -n -T 600 -P 5 -c 4 -j 1 -f highmem.sql@10 -b select-only@90 dbmem
Observe memory behaviors from Performance Insights:
Observe the freeable memory metric during the test run period. Freeable memory was at ~3.5 GB before the test, and as the test runs, Freeable memory dropped down immediately to 200 MB (0.2GB).
Although there were minimum activities happening in the database, a signficant portion of memory was used and big memory variations occured during that one workload execution. This confirms the behaviors of the problem reported i.e. high memory usage during workload execution.
Analysis
For PostgreSQL, the major memory consumers can be classified into the following categories:
- Gobal shared memory for data cache
- Query memory usage
- Connection memory usage
Global shared memory is allocated during instance startup. Since the memory issue appeared only after the workload began, shared memory can not be the root cause.
With fewer than 10 connections active when memory dropped below 5%, connection-related memory usage is also unlikely to be the problem.
Query memory usage is likely to be the cause of the rapid memory drop.
Review database configuration settings:
SELECT name, setting, unit, boot_val, reset_val FROM pg_settings
WHERE name in (
'shared_buffers',
'work_mem',
'maintenance_work_mem',
'autovacuum_work_mem',
'logical_decoding_work_mem'
);
           name            | setting | unit | boot_val | reset_val
---------------------------+---------+------+----------+-----------
 autovacuum_work_mem       | 499400  | kB   | -1       | 499400
 logical_decoding_work_mem | 65536   | kB   | 65536    | 65536
 maintenance_work_mem      | 261120  | kB   | 65536    | 261120
 shared_buffers            | 1309388 | 8kB  | 16384    | 1309388
 work_mem                  | 4096    | kB   | 4096     | 4096
(5 rows)
All key memory related configuration settings are either set to PostgreSQL engine default or Aurora default. We can rule out configuration setting from cause of the high memory usage.
Review query memory usage:
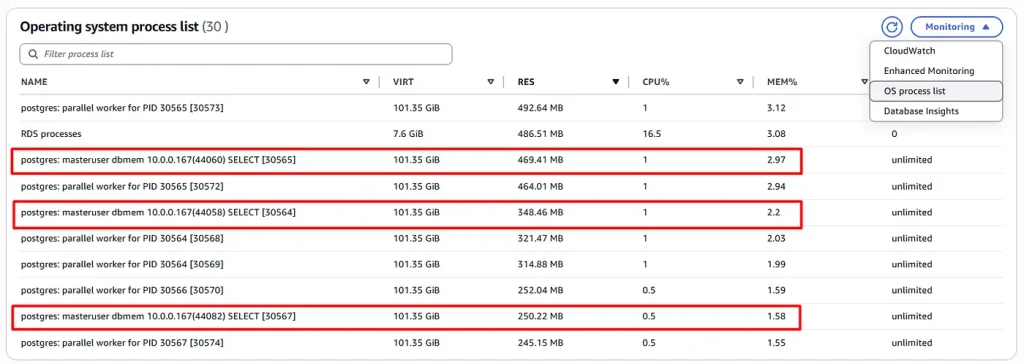
We can observe high memory usage query/user processes being identified as highlighted above. A high RES (Resident Set Size) metric for the process indicates significant memory usage thus signaling the high amount of memory that is being held in RAM by that particular process.
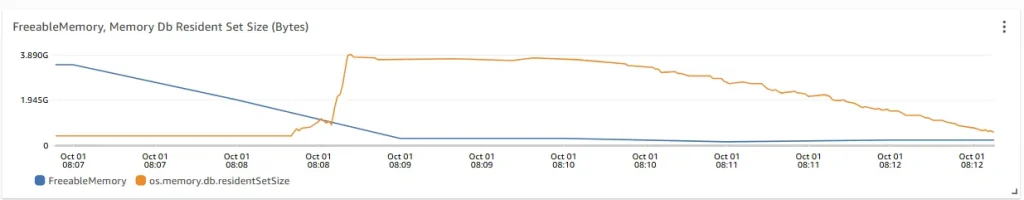
During workload execution, the FreeableMemory metric drops sharply while the database resident set size (RSS) rises significantly. This indicates that the workload is consuming a large amount of memory, often due to complex operations such as large hash tables or aggregations. While some fluctuation is expected, frequent or severe drops in FreeableMemory can throttle other queries, and a high RSS may also signal paging to disk.
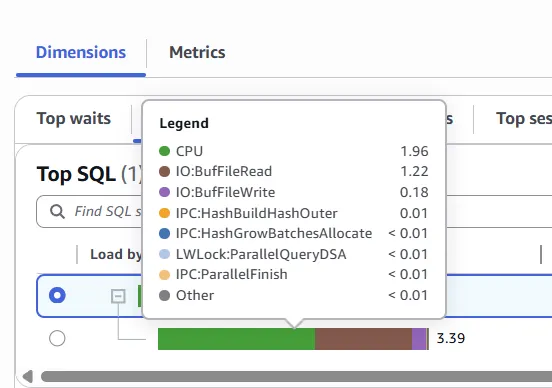
The top wait events causing to the load are IPC:HashGrowBatchesAllocate and IPC:HashBuildHashOuter.
- IPC:HashGrowBatchesAllocate occurs when a process is waiting for an elected parallel hash participant to allocate more batches.
- IPC:HashBuildHashOuter happens when a process is waiting for other parallel hash participants to finish partitioning the outer relation.
- IO:BufFileRead and IO:BufFileWrite appear when Aurora PostgreSQL creates temporary files. This occurs if operations exceed the allocated working memory, forcing temporary data to spill to disk.
select * from aurora_stat_memctx_usage() ORDER BY used DESC;

  pid  |                 name                 | allocated |   used    | instances
-------+--------------------------------------+-----------+-----------+-----------
 31659 | HashTableContext                     | 512778720 | 505430208 |         1
 31667 | HashTableContext                     | 510152800 | 502804288 |         1
 31668 | HashTableContext                     | 510054328 | 502705816 |         1
 31666 | HashTableContext                     | 474965472 | 467616960 |         1
 31665 | HashTableContext                     | 473357096 | 466008584 |         1
 31660 | HashTableContext                     | 472044136 | 464695624 |         1
 31669 | HashTableContext                     | 454942832 | 447594320 |         1
 31662 | HashTableContext                     | 450445944 | 443097432 |         1
 31663 | HashTableContext                     | 449855112 | 442506600 |         1
 31664 | HashTableContext                     | 440270504 | 432921992 |         1
 31661 | HashTableContext                     | 436692688 | 429344176 |         1
 31659 | ExecutorState                        | 129659352 | 129328768 |         1
 31667 | ExecutorState                        | 128960896 | 128575408 |         1
 31668 | ExecutorState                        | 128935936 | 128507376 |         1
 31666 | ExecutorState                        | 120041856 | 119671408 |         1
 31665 | ExecutorState                        | 119634176 | 119173968 |         1
 31660 | ExecutorState                        | 119334232 | 118937968 |         1
 31669 | ExecutorState                        | 114966656 | 114707872 |         1
 31662 | ExecutorState                        | 113859672 | 113726392 |         1
 31663 | ExecutorState                        | 113685376 | 113204176 |         1
 31664 | ExecutorState                        | 111247616 | 110795976 |         1
 31661 | ExecutorState                        | 110373592 | 110011016 |         1
   614 | CacheMemoryContext                   |    524288 |    511848 |         1
   609 | CacheMemoryContext                   |    524288 |    474040 |         1
From the workload output, when sorted by the “used” column in descending order, “HashTableContext” appears at the top. This context represents the memory allocated for hash tables during query execution. The high usage suggests that one or more queries are performing operations such as hash joins, heavy aggregations, or analytical processing, which require building large in-memory hash tables.
Since this memory is allocated on demand and released once the query completes, it explains the sharp drop in free memory observed during execution. Overall, the results indicate intensive use of hash tables, which may warrant query tuning or optimization.
How to resolve
Canceling the query releases its allocated memory back to the system. This provides short-term relief from memory pressure, ensuring other processes can continue running while the problematic query is being tuned.
SELECT pg_cancel_backend(PID);
Query Optimization:
Excessive memory consumption is often caused by suboptimal query plans, which can arise for various reasons in PostgreSQL’s planner. For a long-term solution, queries should be optimized using techniques such as:
- Ensuring statistics are up to date
- Verifying that necessary indexes exist
- Improving efficiency by pushing down predicates and adjusting join strategies
- Considering table partitioning for large datasets
- Splitting complex queries into simpler ones where possible
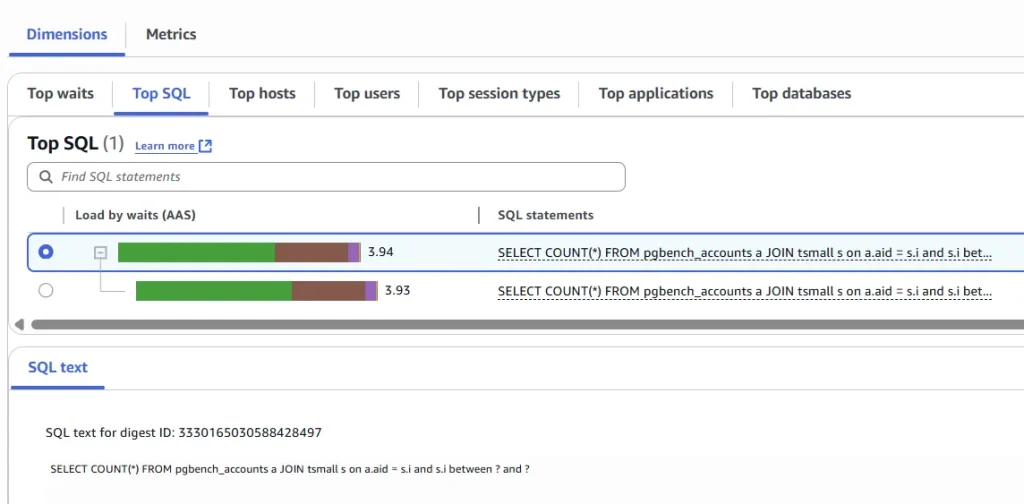
Review the execution plan of the problematic high-memory consuming query identified from the Performance Insights:
EXPLAIN (ANALYZE, buffers)  SELECT COUNT(*) FROM pgbench_accounts a JOIN tsmall s on a.aid = s.i;

                                                                           QUERY PLAN
-----------------------------------------------------------------------------------------------------------------------------------------------------------------
 Finalize Aggregate  (cost=356320.56..356320.57 rows=1 width=8) (actual time=362629.590..364100.694 rows=1 loops=1)
   Buffers: shared hit=186238, temp read=84153 written=276044
   I/O Timings: temp read=154279.691 write=48211.975
   ->  Gather  (cost=356320.34..356320.55 rows=2 width=8) (actual time=362565.190..364098.199 rows=3 loops=1)
         Workers Planned: 2
         Workers Launched: 2
         Buffers: shared hit=186238, temp read=84153 written=276044
         I/O Timings: temp read=154279.691 write=48211.975
         ->  Partial Aggregate  (cost=355320.34..355320.35 rows=1 width=8) (actual time=362560.600..362561.538 rows=1 loops=3)
               Buffers: shared hit=186238, temp read=84153 written=276044
               I/O Timings: temp read=154279.691 write=48211.975
               ->  Parallel Hash Join  (cost=75120.55..350305.17 rows=2006069 width=0) (actual time=302576.163..362426.111 rows=1668333 loops=3)
                     Hash Cond: (a.aid = s.i)
                     Buffers: shared hit=186238, temp read=84153 written=276044
                     I/O Timings: temp read=154279.691 write=48211.975
                     ->  Parallel Seq Scan on pgbench_accounts a  (cost=0.00..205601.67 rows=4166667 width=4) (actual time=0.012..1154.173 rows=3333333 loops=3)
                           Buffers: shared hit=163935
                     ->  Parallel Hash  (cost=42207.69..42207.69 rows=2006069 width=4) (actual time=9312.464..9312.638 rows=1668333 loops=3)
                           Buckets: 262144 (originally 262144)  Batches: 16384 (originally 32)  Memory Usage: 197664kB
                           Buffers: shared hit=22147, temp read=16027 written=79436
                           I/O Timings: temp read=73.645 write=5277.683
                           ->  Parallel Seq Scan on tsmall s  (cost=0.00..42207.69 rows=2006069 width=4) (actual time=0.009..270.674 rows=1668333 loops=3)
                                 Buffers: shared hit=22147
 Planning:
   Buffers: shared hit=172
 Planning Time: 0.663 ms
 Execution Time: 364120.388 ms
(27 rows)
Parallel Hash Join  (cost=75120.55..350305.17 rows=2006069 width=0) (actual time=302576.163..362426.111 rows=1668333 loops=3)

Parallel Seq Scan on pgbench_accounts a  (cost=0.00..205601.67 rows=4166667 width=4) (actual time=0.012..1154.173 rows=3333333 loops=3)

Parallel Hash  (cost=42207.69..42207.69 rows=2006069 width=4) (actual time=9312.464..9312.638 rows=1668333 loops=3)

Parallel Seq Scan on tsmall s  (cost=0.00..42207.69 rows=2006069 width=4) (actual time=0.009..270.674 rows=1668333 loops=3)

Execution Time: 364120.388 ms
- First, the execution plan shows a gap between the estimated row counts and costs versus the actual row counts, indicating outdated statistics.
- Second, the EXPLAIN ANALYZE output reveals discrepancies between estimated and actual runtime metrics (time and rows), again pointing to statistics issues.
- Finally, the plan includes a parallel hash join and a parallel sequential scan on the tsmall table. The sequential scan indicates the planner is scanning the entire table instead of using an index, further suggesting missing or outdated statistics.
Update the Table statistics using the “ANALYZE” command:
ANALYZE VERBOSE tsmall;
INFO:  analyzing "public.tsmall"
INFO:  "tsmall": scanned 22147 of 22147 pages, containing 5005000 live rows and 0 dead rows; 30000 rows in sample, 5005000 estimated total rows
ANALYZE

select * FROM pg_stat_all_tables WHERE relname='tsmall';
 relid | schemaname | relname | seq_scan | seq_tup_read | idx_scan | idx_tup_fetch | n_tup_ins | n_tup_upd | n_tup_del | n_tup_hot_upd | n_live_tup | n_dead_tup | n_mod_since_analyze | n_ins_since_vacuum | last_vacuum |        last_auto
vacuum        |         last_analyze          |       last_autoanalyze        | vacuum_count | autovacuum_count | analyze_count | autoanalyze_count
-------+------------+---------+----------+--------------+----------+---------------+-----------+-----------+-----------+---------------+------------+------------+---------------------+--------------------+-------------+-----------------
--------------+-------------------------------+-------------------------------+--------------+------------------+---------------+-------------------
 24609 | public     | tsmall  |       92 |    175175000 |          |               |   5005000 |         0 |         0 |             0 |    5005000 |          0 |                   0 |            5000000 |             | 2025-10-01 08:02
:43.379552+00 | 2025-10-01 09:01:02.949887+00 | 2025-10-01 08:02:43.385547+00 |            0 |                1 |             2 |                 1
(1 row)
Now that we have updated the table statistics, let’s verify the query memory usage again by re-running the problematic workload and reviewing the FreeableMemory metric while it’s running.
EXPLAIN (ANALYZE, buffers)  SELECT COUNT(*) FROM pgbench_accounts a JOIN tsmall s on a.aid = s.i;

                                                                                   QUERY PLAN
--------------------------------------------------------------------------------------------------------------------------------------------------------------------------------
 Finalize Aggregate  (cost=101370.32..101370.33 rows=1 width=8) (actual time=1998.419..2000.650 rows=1 loops=1)
   Buffers: shared hit=42160
   ->  Gather  (cost=101370.11..101370.32 rows=2 width=8) (actual time=1980.242..2000.640 rows=3 loops=1)
         Workers Planned: 2
         Workers Launched: 2
         Buffers: shared hit=42160
         ->  Partial Aggregate  (cost=100370.11..100370.12 rows=1 width=8) (actual time=1983.931..1983.934 rows=1 loops=3)
               Buffers: shared hit=42160
               ->  Nested Loop  (cost=0.45..95156.57 rows=2085417 width=0) (actual time=0.037..1743.965 rows=1668333 loops=3)
                     Buffers: shared hit=42160
                     ->  Parallel Seq Scan on tsmall s  (cost=0.00..43001.17 rows=2085417 width=4) (actual time=0.008..310.392 rows=1668333 loops=3)
                           Buffers: shared hit=22147
                     ->  Memoize  (cost=0.45..0.62 rows=1 width=4) (actual time=0.000..0.000 rows=1 loops=5005000)
                           Cache Key: s.i
                           Cache Mode: logical
                           Hits: 1816112  Misses: 3192  Evictions: 0  Overflows: 0  Memory Usage: 325kB
                           Buffers: shared hit=20013
                           Worker 0:  Hits: 1448207  Misses: 1  Evictions: 0  Overflows: 0  Memory Usage: 1kB
                           Worker 1:  Hits: 1735679  Misses: 1809  Evictions: 0  Overflows: 0  Memory Usage: 184kB
                           ->  Index Only Scan using pgbench_accounts_pkey on pgbench_accounts a  (cost=0.43..0.61 rows=1 width=4) (actual time=0.004..0.004 rows=1 loops=5002)
                                 Index Cond: (aid = s.i)
                                 Heap Fetches: 5002
                                 Buffers: shared hit=20013
 Planning:
   Buffers: shared hit=172
 Planning Time: 0.718 ms
 Execution Time: 2000.818 ms
Execution time dropped from about 6 minutes in the previous plan to just 2 seconds.
The new plan also replaces the parallel hash join with a nested loop and uses an index-only scan on the pgbench_accounts table, instead of the earlier parallel sequential scan.
Re-run the same workload:
pgbench --progress-timestamp -M prepared -n -T 600 -P 5 -c 4 -j 1 -f highmem.sql@10 -b select-only@90 dbmem
Press enter or click to view image in full size
Observe the FreeableMemory metric during the period the workload was re-executed. Freeable memory was at ~3.5 GB before the test began, and when the same workload was going on and even post execution the FreeableMemory metric did not drop down significantly as it was doing before the statistics updation.
Conclusions
Even a simple workload or query can sometimes lead to high consumption of available memory. There are multiple ways to diagnose and address this. Tools such as Enhanced Monitoring, OS process lists, Performance Insights, and CloudWatch metrics can help pinpoint the root cause of excessive memory usage.
Depending on the findings, solutions may include reviewing and tuning query plans, adjusting memory configuration parameters, or scaling the PostgreSQL instance to a larger size if required to meet higher memory demands.