This is the third part in our series troubleshooting Amazon Aurora PostgreSQL performance issues.
Read part 1 here about idle connections, MultiXacts, and query memory consumption
Read part 2 here about Subtransactions, Runaway query, and Increased Logical Replication Lag
In part 3, we will cover the following issues:
- Stale Statistics in High-Churn Data
- Vacuum is unable to clean up dead tuples
- Impacts of no partition pruning
Stale Statistics in High-Churn Data
PostgreSQL relies on statistics — such as data distribution, cardinality, and histograms — to help the optimizer choose efficient execution plans. However, when tables undergo frequent inserts and deletes, the statistics can quickly become outdated, resulting in inefficient plans.
In high-churn systems, such as e-commerce order databases where new orders are constantly added and old ones removed, PostgreSQL’s automatic statistic updates may not always keep pace. As a result, the optimizer may rely on stale statistics, causing it to select suboptimal plans — for example, choosing full table scans instead of indexes, underestimating result sizes, or consuming excessive memory. To prevent this, PostgreSQL uses ANALYZE to refresh statistics. However, in some cases, auto-analyze does not run often enough, requiring manual intervention to keep the optimizer accurate and query performance stable.
Problem
In our PostgreSQL-based e-commerce order system, query performance degrades after periods of high activity, characterized by large volumes of order inserts and deletes. Because the statistics aren’t updated quickly enough, the optimizer relies on stale data and generates poor execution plans.
Queries that once ran efficiently now take much longer, with some that should use indexes instead performing sequential scans. This leads to high CPU usage, slower response times, and impacts on real-time analytics and order processing, ultimately affecting both customer experience and system scalability.
Symptoms
- Query execution times increase significantly after large-scale deletions and insertions
- Sequential scans replace index scans, causing unnecessary full-table scans
- CPU and memory usage spike, even for simple queries
- PostgreSQL statistics do not reflect the latest data distribution when checked via pg_stats
- Auto-analyze does not trigger automatically, leaving stale statistics unchanged
How to simulate
Create Sample Database:
psql
-- Initialize database
CREATE DATABASE dbstatistics;
\c dbstatistics
\q
Generate sample dataset:
pgbench -i --fillfactor=90 --scale=100 dbstatistics
 psql
 SELECT pg_size_pretty(pg_database_size('dbstatistics'));
 \q
SELECT pg_size_pretty(pg_database_size('dbstatistics'));
 pg_size_pretty
----------------
 1643 MB
(1 row)
Create Orders Table, Indexes & Load Data:
  psql -d dbstatistics
  -- Create orders table with more columns
 DROP TABLE IF EXISTS pgbench_orders;
 CREATE TABLE pgbench_orders (
    order_id SERIAL PRIMARY KEY,
    account_id INTEGER NOT NULL,
    amount INTEGER NOT NULL,
    status VARCHAR(20),
    priority INTEGER,
    created_at TIMESTAMP DEFAULT CURRENT_TIMESTAMP
);

-- Insert 10M rows sorted by priority to simulate high correlation
INSERT INTO pgbench_orders (account_id, amount, status, priority, created_at)
SELECT *
FROM (
  SELECT
    (random() * 10000000)::int AS account_id,
    CASE
        WHEN random() < 0.7 THEN random() * 200 + 50
        WHEN random() < 0.9 THEN random() * 500 + 250
        ELSE random() * 1000 + 750
    END AS amount,
    CASE
        WHEN random() < 0.7 THEN 'completed'
        WHEN random() < 0.9 THEN 'processing'
        ELSE 'pending'
    END AS status,
    CASE
        WHEN random() < 0.8 THEN 2
        ELSE 1
    END AS priority,
    now() - (random() * interval '45 days') AS created_at
  FROM generate_series(1, 10000000)
) AS sorted_data
ORDER BY priority;
Disable Auto Stats & Create Indexes:
-- Disable automatic statistics updates for our demonstration
ALTER TABLE pgbench_orders SET (
    autovacuum_enabled = false,
    autovacuum_vacuum_scale_factor = 0.0,
    autovacuum_vacuum_threshold = 2147483647,
    autovacuum_vacuum_insert_scale_factor = 0.0,
    autovacuum_vacuum_insert_threshold = 2147483647,
    autovacuum_analyze_scale_factor = 0.4,
    autovacuum_analyze_threshold = 2147483647
);

-- Create index
CREATE INDEX idx_orders_priority_amount ON pgbench_orders(priority, amount);
Gather initial statistics:
-- Gather initial statistics
ANALYZE pgbench_orders;
Disable Parallel query execution:
-- Disable Parallel execution
SET max_parallel_workers_per_gather = 0;
Check initial distribution, Correlation & Query Plan:
-- Check initial distribution
SELECT status, priority,
       COUNT(*) as count,
       COUNT(*) * 100.0 / SUM(COUNT(*)) OVER () as percentage
FROM pgbench_orders
GROUP BY status, priority
ORDER BY status, priority;

   status   | priority |  count  |       percentage
------------+----------+---------+------------------------
 completed  |        1 | 1402078 |    14.0207800000000000
 completed  |        2 | 5596490 |    55.9649000000000000
 pending    |        1 |   60042 | 0.60042000000000000000
 pending    |        2 |  239400 |     2.3940000000000000
 processing |        1 |  541259 |     5.4125900000000000
 processing |        2 | 2160731 |    21.6073100000000000
(6 rows)
Run the following command to view the initial correlation between status & priority:
--Let us check the correlation between status and priority
SELECT corr(
    CASE status
        WHEN 'completed' THEN 0
        WHEN 'processing' THEN 1
        ELSE 2
    END,
    priority::int
) as status_priority_correlation
FROM pgbench_orders;

 status_priority_correlation
-----------------------------
      -2.490101646666627e-05
(1 row)
This query is used to analyze high-value (greater than $500) completed orders with standard priority to:
- Identify potential VIP customer upgrades
- Optimize order processing resources
- Evaluate priority assignment rules
-- Observe the query execution plan
EXPLAIN (ANALYZE, BUFFERS)
SELECT status, priority, COUNT(*), AVG(amount)
FROM pgbench_orders
WHERE status = 'completed'
AND priority = 2
AND amount > 500
GROUP BY status, priority;


                                                                             QUERY PLAN
--------------------------------------------------------------------------------------------------------------------------------------------------------------------
 GroupAggregate  (cost=0.43..196642.93 rows=6 width=54) (actual time=1500.867..1500.868 rows=1 loops=1)
   Group Key: status, priority
   Buffers: shared hit=1284635
   ->  Index Scan using idx_orders_priority_amount on pgbench_orders  (cost=0.43..187158.65 rows=948420 width=18) (actual time=0.068..1343.132 rows=922685 loops=1)
         Index Cond: ((priority = 2) AND (amount > 500))
         Filter: ((status)::text = 'completed'::text)
         Rows Removed by Filter: 394987
         Buffers: shared hit=1284635
 Planning:
   Buffers: shared hit=19
 Planning Time: 0.161 ms
 Execution Time: 1500.906 ms
(12 rows)
Several factors can cause PostgreSQL statistics to become stale over time. The most common include:
- High volume of DML operations: Large inserts without updated statistics can cause the planner to underestimate row counts, while mass deletions can lead it to assume rows still exist, skewing selectivity estimates.
- Autovacuum not running or misconfigured: Autovacuum triggers ANALYZE, but if disabled or poorly tuned, statistics may not refresh often enough. High values for autovacuum_analyze_threshold or autovacuum_analyze_scale_factor can also delay updates.
- Bulk data modifications without ANALYZE: Running large inserts, updates, or deletes without a manual ANALYZE leaves old distributions in place, often causing unnecessary sequential scans or inaccurate row estimates.
- Index usage and correlation changes: Index efficiency depends on column correlation. For example, a column once strongly correlated with its index (0.9) may lose correlation after frequent updates, reducing the index’s effectiveness.
Simulating a Business Logic Change
This step replicates a common real-world scenario: a business logic update or batch operation that modifies a large number of rows in a table (for example, updating the status of tasks or tickets). To simulate this, we execute many UPDATE statements without running ANALYZE right away. This models the accumulation of stale statistics that often occurs in production environments.
--Now let us simulate a business change where high-value orders get higher priority
BEGIN;
-- Update priority for high-value orders
UPDATE pgbench_orders
SET priority = 0
WHERE amount > 750
AND status = 'completed';

--Check updated correlation between status and priority
SELECT corr(
    CASE status
        WHEN 'completed' THEN 0
        WHEN 'processing' THEN 1
        ELSE 2
    END,
    priority::int
) as status_priority_correlation
FROM pgbench_orders;

COMMIT;


 status_priority_correlation
-----------------------------
        0.049741416165677683
(1 row)
The status and priority columns are likely to have dependencies. For example, completed orders might have a different priority distribution compared to pending or processing orders
Re-run this query to analyze high-value completed orders:
EXPLAIN (ANALYZE, BUFFERS)
SELECT status, priority, COUNT(*), AVG(amount)
FROM pgbench_orders
WHERE status = 'completed'
AND priority = 2
AND amount > 500
GROUP BY status, priority;


                                                                             QUERY PLAN
--------------------------------------------------------------------------------------------------------------------------------------------------------------------
 GroupAggregate  (cost=0.43..200808.08 rows=6 width=54) (actual time=1760.974..1760.975 rows=1 loops=1)
   Group Key: status, priority
   Buffers: shared hit=1284846
   ->  Index Scan using idx_orders_priority_amount on pgbench_orders  (cost=0.43..191124.82 rows=968319 width=18) (actual time=0.108..1631.636 rows=754798 loops=1)
         Index Cond: ((priority = 2) AND (amount > 500))
         Filter: ((status)::text = 'completed'::text)
         Rows Removed by Filter: 394987
         Buffers: shared hit=1284846
 Planning:
   Buffers: shared hit=2
 Planning Time: 0.142 ms
 Execution Time: 1761.023 ms
(12 rows)
Since autovacuum is disabled, the statistics have not been refreshed automatically. As a result, the planner continues to rely on stale correlation values leading to inefficient index plan and higher execution times.
Now let’s test a different update that creates stronger correlation where completed orders have the highest priority, processing orders have a medium priority, and pending orders have the lowest priority.
-- Create strong Correlation.
BEGIN;
-- Update to create strong correlation between status and priority
UPDATE pgbench_orders
SET priority = CASE
    WHEN status = 'completed' THEN 0
    WHEN status = 'processing' THEN 2
    ELSE 1 END;

--Let us check the correlation between status and priority
SELECT corr(
    CASE status
        WHEN 'completed' THEN 0
        WHEN 'processing' THEN 1
        ELSE 2
    END,
    priority::int
) as status_priority_correlation
FROM pgbench_orders;

COMMIT;


 status_priority_correlation
-----------------------------
          0.8769921414941245
(1 row)
Re-run the Query again to look at the query execution plan:
EXPLAIN (ANALYZE, BUFFERS)
SELECT status, priority, COUNT(*), AVG(amount)
FROM pgbench_orders
WHERE status = 'completed'
AND priority = 2
AND amount > 500
GROUP BY status, priority;


                                                                            QUERY PLAN
-------------------------------------------------------------------------------------------------------------------------------------------------------------------
 GroupAggregate  (cost=0.44..394719.01 rows=6 width=54) (actual time=2236.313..2236.314 rows=0 loops=1)
   Group Key: status, priority
   Buffers: shared hit=1721121
   ->  Index Scan using idx_orders_priority_amount on pgbench_orders  (cost=0.44..375717.97 rows=1900096 width=18) (actual time=2236.311..2236.311 rows=0 loops=1)
         Index Cond: ((priority = 2) AND (amount > 500))
         Filter: ((status)::text = 'completed'::text)
         Rows Removed by Filter: 444928
         Buffers: shared hit=1721121
 Planning:
   Buffers: shared hit=2
 Planning Time: 0.137 ms
 Execution Time: 2236.357 ms
(12 rows)
Now PostgreSQL planner may still assume low correlation from stale stats, and might still use the index — or switch to a sequential scan depending on how much was disrupted.
In PostgreSQL, the query planner depends on statistics to choose the most efficient execution strategy. These statistics capture details such as distinct value counts, most common values, histograms, and column correlations. In high-churn environments — like e-commerce systems where orders are constantly inserted, updated, or deleted — statistics can quickly become outdated.
When this happens, the planner may misestimate row counts, overlook indexes even when they would help, and select costly operations such as sequential scans instead of index scans. Joins and sorts may also be planned poorly, leading to excessive memory and CPU usage.
To resolve performance issues caused by stale statistics, it’s essential to keep PostgreSQL statistics current. This ensures the optimizer has an accurate view of the data and can choose efficient execution plans. Statistics can be refreshed either manually or automatically, depending on system design and the rate of data changes.
- Run a manual VACUUM and observe the query plans
- Execute ANALYZE on the table to refresh statistics, then re-run the query and review the plans
- Compare the updated query plans to confirm improvements in index usage and overall performance
Run Manual Vacuum
-- Physically rewrite the tables and recalculate the statistics
VACUUM (FULL) pgbench_orders;
This will:
- Remove dead tuples (deleted/outdated rows)
- Mark space as available for reuse
Re-run the query to observe the improvements:
EXPLAIN (ANALYZE, BUFFERS)
SELECT status, priority, COUNT(*), AVG(amount)
FROM pgbench_orders
WHERE status = 'completed'
AND priority = 2
AND amount > 500
GROUP BY status, priority;


                                                                           QUERY PLAN
----------------------------------------------------------------------------------------------------------------------------------------------------------------
 GroupAggregate  (cost=0.43..196638.89 rows=6 width=54) (actual time=443.095..443.096 rows=0 loops=1)
   Group Key: status, priority
   Buffers: shared hit=442124
   ->  Index Scan using idx_orders_priority_amount on pgbench_orders  (cost=0.43..187154.74 rows=948407 width=18) (actual time=443.093..443.094 rows=0 loops=1)
         Index Cond: ((priority = 2) AND (amount > 500))
         Filter: ((status)::text = 'completed'::text)
         Rows Removed by Filter: 444928
         Buffers: shared hit=442124
 Planning:
   Buffers: shared hit=24
 Planning Time: 0.178 ms
 Execution Time: 443.139 ms
(12 rows)
Update the Statistics
-- Gather statistics
ANALYZE VERBOSE pgbench_orders;
Re-run the same query after ANALYZE:
EXPLAIN (ANALYZE, BUFFERS)
SELECT status, priority, COUNT(*), AVG(amount)
FROM pgbench_orders
WHERE status = 'completed'
AND priority = 2
AND amount > 500
GROUP BY status, priority;

                                                                       QUERY PLAN
--------------------------------------------------------------------------------------------------------------------------------------------------------
 GroupAggregate  (cost=6221.81..202047.97 rows=9 width=54) (actual time=651.383..651.385 rows=0 loops=1)
   Group Key: status, priority
   Buffers: shared hit=81628
   ->  Bitmap Heap Scan on pgbench_orders  (cost=6221.81..198850.57 rows=319729 width=18) (actual time=651.381..651.382 rows=0 loops=1)
         Recheck Cond: ((priority = 2) AND (amount > 500))
         Rows Removed by Index Recheck: 3785429
         Filter: ((status)::text = 'completed'::text)
         Rows Removed by Filter: 444928
         Heap Blocks: exact=48080 lossy=33148
         Buffers: shared hit=81628
         ->  Bitmap Index Scan on idx_orders_priority_amount  (cost=0.00..6141.88 rows=457344 width=0) (actual time=33.355..33.355 rows=444928 loops=1)
               Index Cond: ((priority = 2) AND (amount > 500))
               Buffers: shared hit=400
 Planning:
   Buffers: shared hit=29
 Planning Time: 0.224 ms
 Execution Time: 652.079 ms
(17 rows)
After running ANALYZE, the query plan changes to use a bitmap heap scan, which is more efficient for for queries involving multiple conditions. The bitmap heap scan can better handle the filter on status after the index scan on priority and amount.
Conclusions
Use execution time, buffer usage, and scan type (Index vs. Bitmap) to demonstrate the performance gains.
In both cases, refreshing statistics and establishing a stronger correlation between status and priority significantly improved query performance. With up-to-date statistics, the planner generated more efficient execution plans, leading to faster runtimes and more optimized query processing.
In PostgreSQL, the query planner depends on statistics to choose efficient execution plans. When these statistics become stale, query performance suffers. Keeping statistics updated — whether through automatic processes or manual collection — ensures better plans and improved performance.
Vacuum not able to cleanup dead tuples
In PostgreSQL’s MVCC (Multi-Version Concurrency Control) model, tuples deleted or made obsolete by updates are marked as dead but not removed immediately. Their space is later reclaimed by the background VACUUM process. Running VACUUM regularly is essential, particularly for heavily updated tables.
When VACUUM is blocked, dead tuples accumulate and cause table and index bloat, leading to progressively slower query execution times.
Problem
We have been seeing increasing query response time:
- Frequent updates on the tables affected
- Autovacuum is enabled
Symptoms
- Elevated query response time
How to simulate
Create sample database:
psql
Create database dbvacuum;
\c dbvacuum
\q
Generate sample dataset:
  pgbench -i --fillfactor=100 --scale=100 dbvacuum

  psql
  SELECT pg_size_pretty(pg_database_size('dbvacuum'));
  \q


 pg_size_pretty
----------------
 1503 MB
(1 row)
Simulate user 1 starting a long-running transaction:
psql dbvacuum
  SET max_parallel_workers_per_gather = 0;

  BEGIN; SET TRANSACTION ISOLATION LEVEL REPEATABLE READ;
    explain (analyze, buffers) select sum(abalance) from pgbench_accounts;


                                                              QUERY PLAN
--------------------------------------------------------------------------------------------------------------------------------------
 Aggregate  (cost=288935.00..288935.01 rows=1 width=8) (actual time=2121.952..2121.953 rows=1 loops=1)
   Buffers: shared hit=163935
   ->  Seq Scan on pgbench_accounts  (cost=0.00..263935.00 rows=10000000 width=4) (actual time=0.006..1375.442 rows=10000000 loops=1)
         Buffers: shared hit=163935
 Planning:
   Buffers: shared hit=57
 Planning Time: 0.255 ms
 Execution Time: 2122.019 ms
(8 rows)
We started a transaction, but did not issue any COMMIT/ROLLBACK/END to close the transaction.
Simulate user 2 running update/delete activities:
psql dbvacuum

  update pgbench_accounts set abalance = abalance + 100 where aid % 3 = 0;
  \q
Observe the impact to query performance:
explain (analyze, buffers) select sum(abalance) from pgbench_accounts;

                                                              QUERY PLAN
--------------------------------------------------------------------------------------------------------------------------------------
 Aggregate  (cost=343797.91..343797.92 rows=1 width=8) (actual time=2279.009..2279.010 rows=1 loops=1)
   Buffers: shared hit=218719
   ->  Seq Scan on pgbench_accounts  (cost=0.00..318782.13 rows=10006313 width=4) (actual time=0.012..1529.200 rows=10000000 loops=1)
         Buffers: shared hit=218719
 Planning:
   Buffers: shared hit=14
 Planning Time: 0.118 ms
 Execution Time: 2279.038 ms
(8 rows)
Query execution time and buffers processed have increased.
Review global and table level autovacuum settings:
psql dbvacuum

    SELECT name, setting FROM pg_settings WHERE name like '%autovacuum%';

    SELECT reloptions FROM pg_class WHERE relname='pgbench_accounts';
    \q


                 name                  |  setting
---------------------------------------+-----------
 autovacuum                            | on                 <------
 autovacuum_analyze_scale_factor       | 0.05
 autovacuum_analyze_threshold          | 50
 autovacuum_freeze_max_age             | 200000000
 autovacuum_max_workers                | 3
 autovacuum_multixact_freeze_max_age   | 400000000
 autovacuum_naptime                    | 5
 autovacuum_vacuum_cost_delay          | 5
 autovacuum_vacuum_cost_limit          | 1200
 autovacuum_vacuum_insert_scale_factor | 0.2
 autovacuum_vacuum_insert_threshold    | 1000
 autovacuum_vacuum_scale_factor        | 0.1
 autovacuum_vacuum_threshold           | 50
 autovacuum_work_mem                   | 2029999
 log_autovacuum_min_duration           | 10000
 rds.force_autovacuum_logging_level    | warning
(16 rows)


    reloptions
------------------
 {fillfactor=100}
(1 row)
Review for any bloated table issue.
 psql dbvacuum

  SELECT relname, n_tup_ins, n_tup_upd, n_tup_del, n_live_tup, n_dead_tup, last_autovacuum FROM pg_stat_user_tables
  WHERE relname ='pgbench_accounts';
  \q


     relname      | n_tup_ins | n_tup_upd | n_tup_del | n_live_tup | n_dead_tup |        last_autovacuum
------------------+-----------+-----------+-----------+------------+------------+-------------------------------
 pgbench_accounts |  10000000 |  13333332 |         0 |   10006313 |    3333333 | 2025-10-02 11:06:11.982752+00
(1 row)
Dead tuples: PostgreSQL uses multiversion concurrency control (MVCC) to support concurrent read and write operations. When a row is updated, a new version of the row, known as a tuple, is created and inserted into the table. The old version of the row, referred to as a dead tuple, is not physically removed but is marked as invisible for future transactions.
Verify problem with vacuum cleaning up dead tuples
vacuum verbose pgbench_accounts;

INFO:  vacuuming "dbvacuum.public.pgbench_accounts"
INFO:  finished vacuuming "dbvacuum.public.pgbench_accounts": index scans: 0
pages: 0 removed, 218719 remain, 218581 scanned (99.94% of total)

tuples: 0 removed, 13339646 remain, 3333333 are dead but not yet removable  <---------

removable cutoff: 1301165, which was 363 XIDs old when operation ended
index scan not needed: 0 pages from table (0.00% of total) had 0 dead item identifiers removed
I/O timings: read: 0.000 ms, write: 0.000 ms
avg read rate: 0.000 MB/s, avg write rate: 0.000 MB/s
buffer usage: 438143 hits, 0 misses, 0 dirtied
WAL usage: 0 records, 0 full page images, 0 bytes
system usage: CPU: user: 0.98 s, system: 0.00 s, elapsed: 0.98 s
VACUUM
By running “vacuum verbose” manually, we can confirmed that 3333333 dead tuples was not able to be cleanup. Any active long-running transaction(s) that are accessing those tuples could prevent vacuum from freeing the dead tuples.
Check for any long-running transactions:
psql dbvacuum

  SELECT pid,
    datname, usename, state, backend_xmin, backend_xid,
    now() - pg_stat_activity.xact_start AS transaction_duration
  FROM
    pg_stat_activity
  WHERE
    backend_xmin IS NOT NULL OR backend_xid IS NOT NULL
  ORDER BY
    transaction_duration DESC
  LIMIT 3;
  \q


 pid  | datname  |  usename   |        state        | backend_xmin | backend_xid | transaction_duration
------+----------+------------+---------------------+--------------+-------------+----------------------
 4246 | dbvacuum | masteruser | idle in transaction |      1301165 |             | 00:07:20.415585
 4691 | dbvacuum |            | active              |      1301165 |             | 00:00:01.123002
The result showed PID 4246 has a transaction opened, but not currently executing any commands (state = idle in transaction)
psql dbvacuum

  SELECT
    query, state,locktype,mode
  FROM
    pg_locks JOIN pg_stat_activity USING (pid)
  WHERE
    relation::regclass = 'pgbench_accounts'::regclass
    AND granted IS TRUE
    AND backend_xmin IS NOT NULL
    AND pid = 4246;
  \q


                                 query                                  |        state        | locktype |      mode
------------------------------------------------------------------------+---------------------+----------+-----------------
 explain (analyze, buffers) select sum(abalance) from pgbench_accounts; | idle in transaction | relation | AccessShareLock
(1 row)
Check for any abandon replication slots:
psql dbvacuum

  SELECT
    slot_name,
    database,
    active,
    age(xmin) AS age
  FROM pg_replication_slots;;
  \q

 slot_name | database | active | age
-----------+----------+--------+-----
(0 rows)
Check for any orphaned prepare transactions:
 psql dbvacuum

  SELECT age(transaction),* FROM pg_prepared_xacts;
  \q


 age | transaction | gid | prepared | owner | database
-----+-------------+-----+----------+-------+----------
(0 rows)
How to resolve
Stop long-running transaction:
  psql dbvacuum

  SELECT pid,
    datname, usename, state, backend_xmin, backend_xid,
    now() - pg_stat_activity.xact_start AS transaction_duration
  FROM
    pg_stat_activity
  WHERE
    backend_xmin IS NOT NULL OR backend_xid IS NOT NULL
  ORDER BY
    transaction_duration DESC
  LIMIT 3;
  \q

 pid  | datname  |  usename   |        state        | backend_xmin | backend_xid | transaction_duration
------+----------+------------+---------------------+--------------+-------------+----------------------
 4246 | dbvacuum | masteruser | idle in transaction |      1301165 |             | 00:10:22.636839
 4876 | dbvacuum |            | active              |      1301165 |             | 00:00:00.576367
Kill backend with long-running transaction:
psql dbvacuum

  SELECT pg_terminate_backend(4246);
  \q


 pg_terminate_backend
----------------------
 t
(1 row)
Run vacuum to cleanup dead tuples:
  psql dbvacuum

  vacuum verbose pgbench_accounts;

  \q


INFO:  vacuuming "dbvacuum.public.pgbench_accounts"
INFO:  table "pgbench_accounts": truncated 218719 to 218580 pages
INFO:  finished vacuuming "dbvacuum.public.pgbench_accounts": index scans: 0
pages: 139 removed, 218580 remain, 1 scanned (0.00% of total)
tuples: 0 removed, 10006313 remain, 0 are dead but not yet removable   <------
removable cutoff: 1302585, which was 4 XIDs old when operation ended
index scan not needed: 0 pages from table (0.00% of total) had 0 dead item identifiers removed
I/O timings: read: 0.000 ms, write: 0.000 ms
avg read rate: 0.000 MB/s, avg write rate: 0.000 MB/s
buffer usage: 260 hits, 0 misses, 0 dirtied
WAL usage: 0 records, 0 full page images, 0 bytes
system usage: CPU: user: 0.00 s, system: 0.00 s, elapsed: 0.00 s
VACUUM
Observe there is 0 dead tuples to be removed. After the long-running transaction is killed. Autovacuum is able to effectively remove dead tuples.
Review updates on table bloat:
psql dbvacuum

  SELECT relname, n_tup_ins, n_tup_upd, n_tup_del, n_live_tup, n_dead_tup, last_autovacuum FROM pg_stat_user_tables
  WHERE relname ='pgbench_accounts';
  \q


     relname      | n_tup_ins | n_tup_upd | n_tup_del | n_live_tup | n_dead_tup |        last_autovacuum
------------------+-----------+-----------+-----------+------------+------------+-------------------------------
 pgbench_accounts |  10000000 |  13333332 |         0 |   10006313 |          0 | 2025-10-02 11:18:34.537797+00
(1 row)
Re-run query:
psql dbvacuum
  SET max_parallel_workers_per_gather = 0;

  update pgbench_accounts set abalance = abalance + 100 where aid % 3 = 0;

  vacuum verbose pgbench_accounts;

  explain (analyze, buffers) select sum(abalance) from pgbench_accounts;

  \q


                                                              QUERY PLAN
--------------------------------------------------------------------------------------------------------------------------------------
 Aggregate  (cost=343836.00..343836.01 rows=1 width=8) (actual time=2257.066..2257.067 rows=1 loops=1)
   Buffers: shared hit=218836
   ->  Seq Scan on pgbench_accounts  (cost=0.00..318836.00 rows=10000000 width=4) (actual time=0.010..1509.881 rows=10000000 loops=1)
         Buffers: shared hit=218836
 Planning:
   Buffers: shared hit=10
 Planning Time: 0.075 ms
 Execution Time: 2257.114 ms
Conclusions
- A bloated table increases query execution time over time
- A long-running query can block vacuum from cleaning up free tuples
Impacts of no partition pruning
PostgreSQL’s lock manager uses shared memory structures to manage locks, with lightweight locks protecting these structures from concurrent access conflicts. However, in workloads with many short transactions, frequent lock acquisition and release can turn lock management into a system bottleneck.
To reduce this overhead, PostgreSQL provides the Fast Path lock mechanism, which allows backend processes to handle certain operations (e.g., SELECT, INSERT, UPDATE, DELETE) more efficiently. This mechanism, though, is limited to a maximum of 16 relation locks per backend process.
Once a backend process exceeds this limit, PostgreSQL falls back to the main lock manager in shared memory. In highly concurrent environments, this can introduce significant performance bottlenecks and limit scalability.
Problem
Our applications running on Aurora PostgreSQL are experiencing significant performance degradation as concurrent users increases. Despite having read-only workloads, the database is showing high wait events with slow response time and lower throughput. How can we identify the root cause and resolve this issue?
Symptoms
- RDS Performance Insights report high lock manager (LWLock:lock_manager) wait event
- Average response time of Top SQL increases significantly with high lock manager wait events
How to simulate
Create sample database:
psql
Create database partition;
\c partition
\q
Create pgbench benchmark tables:
cat > cr_pgbench.sql <<EOF
CREATE TABLE pgbench_branches ( bid integer NOT NULL PRIMARY KEY, bbalance integer, filler character(88));
CREATE TABLE pgbench_history ( tid integer, bid integer, aid integer, delta integer, mtime timestamp without time zone, filler character(22));
CREATE TABLE pgbench_tellers ( tid integer NOT NULL PRIMARY KEY, bid integer, tbalance integer, filler character(84));
CREATE TABLE pgbench_accounts ( aid integer NOT NULL, bid integer, abalance integer, filler character(84)) PARTITION BY HASH (bid);
CREATE INDEX pgbench_accounts_idx1 on pgbench_accounts (aid );
EOF

for partnum in {0..99}
do
  echo "CREATE TABLE pgbench_accounts_${partnum} PARTITION OF pgbench_accounts FOR VALUES WITH (modulus 100, remainder ${partnum});" >> cr_pgbench.sql
done

psql -d partition -f cr_pgbench.sql
Generate sample dataset:
 pgbench -i -I gv --scale=100 partition

  psql -c "SELECT pg_size_pretty(pg_database_size('partition'))"

 pg_size_pretty
----------------
 1507 MB
(1 row)
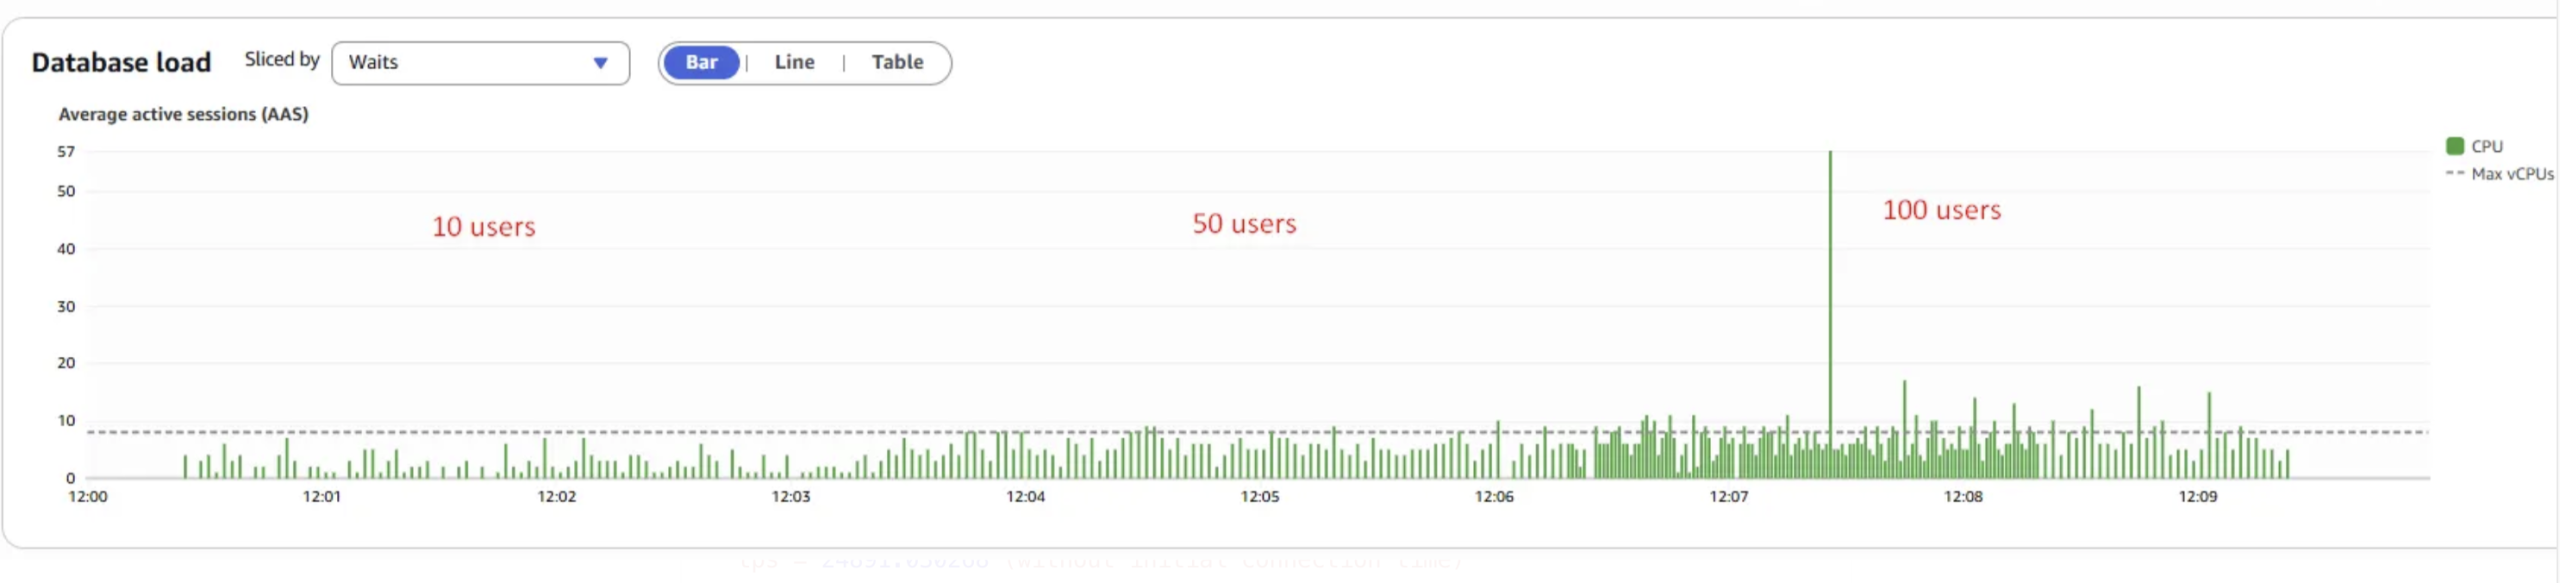
Run a high concurrent read-only workload. Run three sequential pgbench read-only benchmarks with gradually increasing concurrency levels of 10, 50, and 100 simulated users. Let it run for 3 mins for each test. Before running the tests, disable sequential scan in the partition database to force the queries use an index.
psql -c 'alter database partition set enable_seqscan = off'

  pgbench --progress-timestamp -n -T 180 -P 5 -c 10 -M prepared -b select-only partition && pgbench --progress-timestamp -n -T 180 -P 5 -c 50 -M prepared -b select-only partition && pgbench --progress-timestamp -n -T 180 -P 5 -c 100 -M prepared -b select-only partition
Observe database load from Performance Insights:
The LWLock:LockManager wait event increases significantly as concurrency levels rise.
scaling factor: 100
partition method: hash
partitions: 100
query mode: prepared
number of clients: 10                              <---------
number of threads: 1
duration: 180 s
number of transactions actually processed: 398878  <---------
latency average = 4.503 ms                         <---------
latency stddev = 1.751 ms
initial connection time = 125.359 ms
tps = 2217.476446 (without initial connection time)


scaling factor: 100
partition method: hash
partitions: 100
query mode: prepared
number of clients: 50                              <---------
number of threads: 1
duration: 180 s
number of transactions actually processed: 383149  <---------
latency average = 23.375 ms                        <---------
latency stddev = 16.503 ms
initial connection time = 651.200 ms
tps = 2135.828786 (without initial connection time)


scaling factor: 100
partition method: hash
partitions: 100
query mode: prepared
number of clients: 100                             <---------
number of threads: 1
duration: 180 s
number of transactions actually processed: 376767  <---------
latency average = 47.400 ms                        <---------
latency stddev = 45.788 ms
initial connection time = 1329.928 ms
tps = 2107.713811 (without initial connection time)
Looking at the results, as the number of concurrent users increases, transaction response time rises sharply from 4.5 ms to 47.4 ms, and transaction throughput (processed) decreases from 398,878 to 376,767, while throughput decreases from 2217 tps to 2107 tps.
A high LWLock:LockManager wait event in PostgreSQL signals contention on the shared memory lock manager structures used for acquiring and releasing locks.
Since frequent LWLock:LockManager waits were observed during testing, it suggests that most benchmark workloads exceeded the thresholds of the Fast Path mechanism. As a result, PostgreSQL was forced to fall back to the more contention-prone non-Fast Path (NFP) lock manager, leading to increased lock contention.
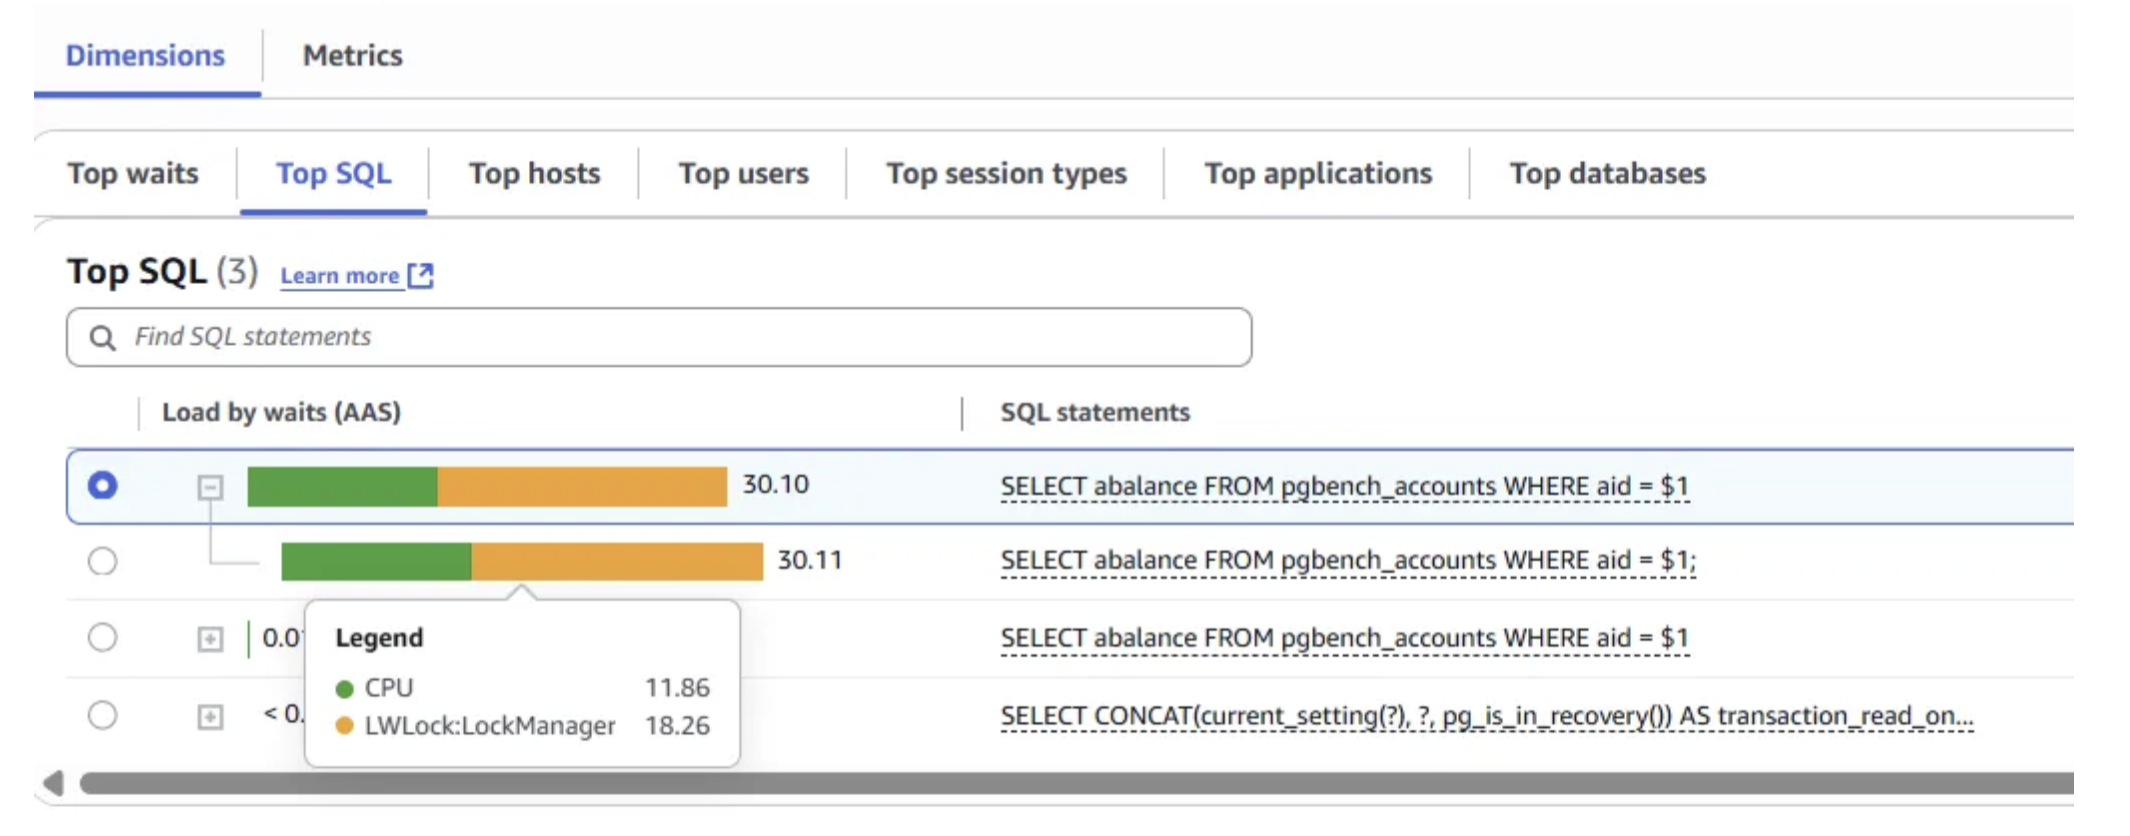
By analyzing the Database Load Chart, Top Waits, and Top SQL sections in Performance Insights, we confirmed that the LWLock:LockManager wait event was the primary bottleneck during scaling tests.
The query SELECT abalance FROM pgbench_accounts WHERE aid = $1 contributed most to this event, as it represents the entire pgbench read-only workload.
Contention on LWLock:LockManager can be reduced by leveraging the Fast Path (FP) locking mechanism, which is available only under certain conditions:
- Locks must be on database relations (tables, indexes, materialized views), not shared relations
- Only weaker locks, such as AccessShareLock, RowShareLock, or RowExclusiveLock, can use FP (commonly acquired by SELECT or DML operations)
- No conflicting locks should exist when the lock is requested
- Each backend process is limited to a maximum of 16 FP locks
The high occurrence of LWLock:LockManager waits suggests that these queries are exceeding FP thresholds and instead falling back to the contention-prone non-Fast Path (NFP) lock manager in shared memory. To validate this, we will further analyze the concurrent workload to determine how many NFP locks are being used.
Review non-Fast path locks
Run the pgbench 100 concurrent user benchmark test:
pgbench --progress-timestamp -n -T 600 -P 5 -c 100 -M prepared -b select-only partition
Review Fast Path and non-Fast Path Locks:
psql -d partition <<EOF
  WITH lockmanager as (
    SELECT pid
      FROM pg_stat_activity
     WHERE wait_event = 'LockManager' )
  SELECT count(distinct l.pid) as num_pid,
         count(1) as total_relation_locks,
         sum(case when fastpath = 't' then 1 else 0 end ) as num_fastpath_locks,
         sum(case when fastpath = 'f' then 1 else 0 end) as num_non_fastpath_locks
    FROM pg_locks l JOIN lockmanager m ON l.pid = m.pid
   WHERE  locktype = 'relation' ;
EOF


 num_pid | total_relation_locks | num_fastpath_locks | num_non_fastpath_locks
---------+----------------------+--------------------+------------------------
      63 |                 8761 |                976 |                   7785
(1 row)
Each backend process is executing a single, identical query “SELECT abalance FROM pgbench_accounts WHERE aid = $1″. This aligns with our earlier findings from Performance Insights Top SQL. We observe that each query has reached the maximum limit of 16 FP locks. Beyond the FP lock limit, each query has acquired a significant number of NFP locks directly contributing to the LWLock:LockManager wait events and contentions.
psql -d partition <<EOF
  WITH locks as (
  SELECT pid,
         sum(case when fastpath = 't' then 1 else 0 end ) as num_fastpath_locks,
         sum(case when fastpath = 'f' then 1 else 0 end) as num_non_fastpath_locks
    FROM pg_locks
   WHERE locktype = 'relation'
   GROUP BY pid )
  SELECT a.pid, l.num_fastpath_locks, l.num_non_fastpath_locks, substr(a.query,1,100) as query
    FROM pg_stat_activity a JOIN locks l ON a.pid = l.pid
   WHERE a.wait_event = 'LockManager' order by 3 desc ;
EOF


 pid  | num_fastpath_locks | num_non_fastpath_locks |                         query
------+--------------------+------------------------+-------------------------------------------------------
 7100 |                 16 |                    185 | SELECT abalance FROM pgbench_accounts WHERE aid = $1;
 7004 |                 16 |                    185 | SELECT abalance FROM pgbench_accounts WHERE aid = $1;
 7010 |                 16 |                    185 | SELECT abalance FROM pgbench_accounts WHERE aid = $1;
 7020 |                 16 |                    185 | SELECT abalance FROM pgbench_accounts WHERE aid = $1;
 7038 |                 16 |                    185 | SELECT abalance FROM pgbench_accounts WHERE aid = $1;
 7046 |                 16 |                    185 | SELECT abalance FROM pgbench_accounts WHERE aid = $1;
 7051 |                 16 |                    185 | SELECT abalance FROM pgbench_accounts WHERE aid = $1;
.....................
You can find that the query holds 16 FP locks and multiple NFP locks on both the partitions and the associated indexes of the pgbench_accounts partition table.
psql -d partition <<EOF
  WITH query as (
    SELECT pid, wait_event_type, wait_event, substr(query,1,100) as query
     FROM pg_stat_activity
    WHERE wait_event = 'LockManager'
      AND query like 'SELECT abalance FROM pgbench_accounts%' limit 1 )
    SELECT l.relation::regclass, l.locktype, l.fastpath, q.wait_event_type, q.wait_event, q.query
     FROM pg_locks l, query q
    WHERE l.pid = q.pid
      AND l.locktype = 'relation'  ;
EOF

      relation       | locktype | fastpath | wait_event_type | wait_event  |                         query
---------------------+----------+----------+-----------------+-------------+-------------------------------------------------------
 pgbench_accounts_14 | relation | t  <---  | LWLock          | LockManager | SELECT abalance FROM pgbench_accounts WHERE aid = $1;
 pgbench_accounts_13 | relation | t        | LWLock          | LockManager | SELECT abalance FROM pgbench_accounts WHERE aid = $1;
 pgbench_accounts_12 | relation | t        | LWLock          | LockManager | SELECT abalance FROM pgbench_accounts WHERE aid = $1;
 pgbench_accounts_11 | relation | t        | LWLock          | LockManager | SELECT abalance FROM pgbench_accounts WHERE aid = $1;
 pgbench_accounts_10 | relation | t        | LWLock          | LockManager | SELECT abalance FROM pgbench_accounts WHERE aid = $1;
 pgbench_accounts_9  | relation | t        | LWLock          | LockManager | SELECT abalance FROM pgbench_accounts WHERE aid = $1;
 pgbench_accounts_8  | relation | t        | LWLock          | LockManager | SELECT abalance FROM pgbench_accounts WHERE aid = $1;
 pgbench_accounts_7  | relation | t        | LWLock          | LockManager | SELECT abalance FROM pgbench_accounts WHERE aid = $1;
 pgbench_accounts_6  | relation | t        | LWLock          | LockManager | SELECT abalance FROM pgbench_accounts WHERE aid = $1;
 pgbench_accounts_5  | relation | t        | LWLock          | LockManager | SELECT abalance FROM pgbench_accounts WHERE aid = $1;
 pgbench_accounts_4  | relation | t        | LWLock          | LockManager | SELECT abalance FROM pgbench_accounts WHERE aid = $1;
 pgbench_accounts_3  | relation | t        | LWLock          | LockManager | SELECT abalance FROM pgbench_accounts WHERE aid = $1;
 pgbench_accounts_2  | relation | t        | LWLock          | LockManager | SELECT abalance FROM pgbench_accounts WHERE aid = $1;
 pgbench_accounts_1  | relation | t        | LWLock          | LockManager | SELECT abalance FROM pgbench_accounts WHERE aid = $1;
 pgbench_accounts_0  | relation | t        | LWLock          | LockManager | SELECT abalance FROM pgbench_accounts WHERE aid = $1;
 pgbench_accounts    | relation | t  <---  | LWLock          | LockManager | SELECT abalance FROM pgbench_accounts WHERE aid = $1;
 pgbench_accounts_24 | relation | f        | LWLock          | LockManager | SELECT abalance FROM pgbench_accounts WHERE aid = $1;
 pgbench_accounts_40 | relation | f        | LWLock          | LockManager | SELECT abalance FROM pgbench_accounts WHERE aid = $1;
 pgbench_accounts_17 | relation | f        | LWLock          | LockManager | SELECT abalance FROM pgbench_accounts WHERE aid = $1;
 pgbench_accounts_36 | relation | f        | LWLock          | LockManager | SELECT abalance FROM pgbench_accounts WHERE aid = $1;
...........................
 psql -d partition <<EOF
>   SELECT aid FROM pgbench_accounts limit 1 ;
> EOF
   aid
---------
 5800001
Let’s use the returned value for the query to generate query plan using EXPLAIN command with ANALYZE option. Run the following command.
psql -d partition <<EOF
  EXPLAIN ANALYZE SELECT abalance FROM pgbench_accounts WHERE aid = 5800001 ;
EOF


                                                                                 QUERY PLAN
----------------------------------------------------------------------------------------------------------------------------------------------------------------------------
 Append  (cost=0.29..828.85 rows=100 width=4) (actual time=0.024..1.542 rows=1 loops=1)
   ->  Index Scan using pgbench_accounts_0_aid_idx on pgbench_accounts_0 pgbench_accounts_1  (cost=0.29..8.31 rows=1 width=4) (actual time=0.023..0.024 rows=1 loops=1)
         Index Cond: (aid = 5800001)
   ->  Index Scan using pgbench_accounts_1_aid_idx on pgbench_accounts_1 pgbench_accounts_2  (cost=0.29..8.31 rows=1 width=4) (actual time=0.016..0.016 rows=0 loops=1)
         Index Cond: (aid = 5800001)
   ->  Index Scan using pgbench_accounts_2_aid_idx on pgbench_accounts_2 pgbench_accounts_3  (cost=0.12..8.14 rows=1 width=4) (actual time=0.011..0.011 rows=0 loops=1)
         Index Cond: (aid = 5800001)
   ->  Index Scan using pgbench_accounts_3_aid_idx on pgbench_accounts_3 pgbench_accounts_4  (cost=0.29..8.31 rows=1 width=4) (actual time=0.013..0.013 rows=0 loops=1)
         Index Cond: (aid = 5800001)
   ->  Index Scan using pgbench_accounts_4_aid_idx on pgbench_accounts_4 pgbench_accounts_5  (cost=0.42..8.44 rows=1 width=4) (actual time=0.014..0.014 rows=0 loops=1)
         Index Cond: (aid = 5800001)
   ->  Index Scan using pgbench_accounts_5_aid_idx on pgbench_accounts_5 pgbench_accounts_6  (cost=0.42..8.44 rows=1 width=4) (actual time=0.013..0.013 rows=0 loops=1)
         Index Cond: (aid = 5800001)
   ->  Index Scan using pgbench_accounts_6_aid_idx on pgbench_accounts_6 pgbench_accounts_7  (cost=0.29..8.31 rows=1 width=4) (actual time=0.027..0.027 rows=0 loops=1)
         Index Cond: (aid = 5800001)
   ->  Index Scan using pgbench_accounts_7_aid_idx on pgbench_accounts_7 pgbench_accounts_8  (cost=0.12..8.14 rows=1 width=4) (actual time=0.015..0.015 rows=0 loops=1)
         Index Cond: (aid = 5800001)
   ->  Index Scan using pgbench_accounts_8_aid_idx on pgbench_accounts_8 pgbench_accounts_9  (cost=0.42..8.44 rows=1 width=4) (actual time=0.014..0.014 rows=0 loops=1)
         Index Cond: (aid = 5800001)
   ->  Index Scan using pgbench_accounts_9_aid_idx on pgbench_accounts_9 pgbench_accounts_10  (cost=0.29..8.31 rows=1 width=4) (actual time=0.013..0.013 rows=0 loops=1)
         Index Cond: (aid = 5800001)
   ->  Index Scan using pgbench_accounts_10_aid_idx on pgbench_accounts_10 pgbench_accounts_11  (cost=0.29..8.31 rows=1 width=4) (actual time=0.012..0.012 rows=0 loops=1)
         Index Cond: (aid = 5800001)
   ->  Index Scan using pgbench_accounts_11_aid_idx on pgbench_accounts_11 pgbench_accounts_12  (cost=0.29..8.31 rows=1 width=4) (actual time=0.018..0.018 rows=0 loops=1)
         Index Cond: (aid = 5800001)
   ->  Index Scan using pgbench_accounts_12_aid_idx on pgbench_accounts_12 pgbench_accounts_13  (cost=0.42..8.44 rows=1 width=4) (actual time=0.013..0.013 rows=0 loops=1)
The query plan shows that PostgreSQL accesses all the partitions of the pgbench_accounts table, using the aid column index of each partition, despite the value 5800001 existing only in the pgbench_accounts_0 partition. The access pattern not only degrades query performance but also requires relation locks on all the partitions and their corresponding indexes.
psql -d partition <<EOF
  \d pgbench_accounts
EOF

        Partitioned table "public.pgbench_accounts"
  Column  |     Type      | Collation | Nullable | Default
----------+---------------+-----------+----------+---------
 aid      | integer       |           | not null |
 bid      | integer       |           |          |
 abalance | integer       |           |          |
 filler   | character(84) |           |          |
Partition key: HASH (bid)                            <------
Indexes:
    "pgbench_accounts_idx1" btree (aid)
Number of partitions: 100 (Use \d+ to list them.)    <------
The pgbench_accounts table is partitioned into 100 parts using the bid column for hash partitioning. However, the query applies a WHERE condition on the aid column. Since the table is partitioned by bid, the PostgreSQL query planner cannot directly determine which partitions correspond to the aid value. As a result, it generates a plan that scans all partitions. This causes a large number of non-Fast Path (NFP) locks on the partitions and their indexes, leading to significant LWLock:LockManager wait events and contention.
How to resolve
Frequent acquisition and release of locks on shared memory structures in PostgreSQL’s Lock Manager can become a major bottleneck under highly concurrent workloads. These are known as non-Fast Path (NFP) locks. To reduce contention, PostgreSQL offers an optimized Fast Path (FP) locking mechanism, but it only applies under certain conditions:
- Locks must be on database relations (tables, indexes, materialized views), not shared relations
- Locks must be weaker types, such as AccessShareLock, RowShareLock, or RowExclusiveLock, typically used by SELECT and DML operations
- No conflicting locks may exist when the lock is requested
- A backend process can hold a maximum of 16 FP locks
When these conditions are not met, PostgreSQL falls back to NFP locks. In our analysis, the high number of NFP locks stemmed from a query on the 100-partition pgbench_accounts table. Because the table is partitioned by bid while the query filters on aid, the planner cannot prune partitions. Instead, it must scan all partitions and their indexes, resulting in far more than 16 relation locks. This excessive use of NFP locks directly contributed to the LWLock:LockManager contention observed during testing.
To address the issue, the key is to reduce the number of relation locks acquired by the query to fewer than 16, which avoids falling back to NFP locks. Several approaches can help achieve this:
- Schema changes: Modify the partitioning key of the pgbench_accounts table to match the query’s WHERE condition, enabling partition pruning. Partitioning can also be optimized by either increasing partition ranges (fewer, larger partitions) or archiving older data.
- Query rewriting: If business logic allows, adjust the query to filter on the bid column, enabling effective partition pruning.
- Capacity increase: Given the cluster’s high CPU utilization, upgrading to a larger Aurora PostgreSQL instance could reduce CPU contention. However, vertical scaling alone won’t resolve LWLock:LockManager issues caused by excessive NFP locks under highly concurrent workloads.
Create a new pgbench_accounts table with different partitioning key:
cat > cr_pgbench_accounts_new.sql <<EOF
CREATE TABLE pgbench_accounts_new ( aid integer NOT NULL, bid integer, abalance integer, filler character(84)) PARTITION BY HASH (aid);
CREATE INDEX pgbench_accounts_new_idx1 on pgbench_accounts_new (aid );
EOF

for partnum in {0..99}
do
  echo "CREATE TABLE pgbench_accounts_new_${partnum} PARTITION OF pgbench_accounts_new FOR VALUES WITH (modulus 100, remainder ${partnum});" >> cr_pgbench_accounts_new.sql
done

psql -d partition -f cr_pgbench_accounts_new.sql
psql -d partition <<EOF
  \d pgbench_accounts_new
EOF


      Partitioned table "public.pgbench_accounts_new"
  Column  |     Type      | Collation | Nullable | Default
----------+---------------+-----------+----------+---------
 aid      | integer       |           | not null |
 bid      | integer       |           |          |
 abalance | integer       |           |          |
 filler   | character(84) |           |          |
Partition key: HASH (aid)
Indexes:
    "pgbench_accounts_new_idx1" btree (aid)
Number of partitions: 100 (Use \d+ to list them.)
Load data into the new partition table:
psql -d partition -a <<EOD
  SELECT count(1) FROM pgbench_accounts ;
  INSERT INTO pgbench_accounts_new SELECT * FROM pgbench_accounts ;
  SELECT count(1) FROM pgbench_accounts_new ;
  ANALYZE pgbench_accounts_new ;
EOD
Rename the new table to pgbench_accounts:
psql -t -d partition <<EOD
  DROP TABLE pgbench_accounts ;
  \o rename_pgbench_accounts.sql
  select 'ALTER TABLE pgbench_accounts_new RENAME TO pgbench_accounts ;' ;
  select 'ALTER INDEX pgbench_accounts_new_idx1 RENAME TO pgbench_accounts_idx1 ;' ;
  select 'ALTER TABLE '||inhrelid::regclass||' RENAME TO '||replace(inhrelid::regclass::text,'_new','')||' ; ' from pg_inherits where inhparent = 'pgbench_accounts_new'::regclass ;
  select 'ALTER INDEX '||inhrelid::regclass||' RENAME TO '||replace(inhrelid::regclass::text,'_new','')||' ; ' from pg_inherits where inhparent = 'pgbench_accounts_new_idx1'::regclass ;
EOD

psql -d partition -f rename_pgbench_accounts.sql
psql -d partition <<EOF
  \d pgbench_accounts
EOF

        Partitioned table "public.pgbench_accounts"
  Column  |     Type      | Collation | Nullable | Default
----------+---------------+-----------+----------+---------
 aid      | integer       |           | not null |
 bid      | integer       |           |          |
 abalance | integer       |           |          |
 filler   | character(84) |           |          |
Partition key: HASH (aid)
Indexes:
    "pgbench_accounts_idx1" btree (aid)
Number of partitions: 100 (Use \d+ to list them.)
Re-run pgbench read-only workload:
pgbench --progress-timestamp -n -T 180 -P 5 -c 10 -M prepared -b select-only partition && pgbench --progress-timestamp -n -T 180 -P 5 -c 50 -M prepared -b select-only partition && pgbench --progress-timestamp -n -T 180 -P 5 -c 100 -M prepared -b select-only partition
Review database load from Performance Insights:
LWLock:LockManager wait event is now absent in the Database Load chart.
scaling factor: 100
partition method: hash
partitions: 100
query mode: prepared
number of clients: 10
number of threads: 1
duration: 180 s
number of transactions actually processed: 4476993
latency average = 0.374 ms
latency stddev = 0.724 ms
initial connection time = 137.143 ms
tps = 24891.030268 (without initial connection time)


scaling factor: 100
partition method: hash
partitions: 100
query mode: prepared
number of clients: 50
number of threads: 1
duration: 180 s
number of transactions actually processed: 9441999
latency average = 0.842 ms
latency stddev = 0.614 ms
initial connection time = 643.078 ms
tps = 52642.270965 (without initial connection time)


scaling factor: 100
partition method: hash
partitions: 100
query mode: prepared
number of clients: 100
number of threads: 1
duration: 180 s
number of transactions actually processed: 9385260
latency average = 1.761 ms
latency stddev = 1.033 ms
initial connection time = 1289.701 ms
tps = 52514.264068 (without initial connection time)
The transaction throughput(processed) increases from 4,476,993 to 9,385,260 as the number of concurrent users rises from 10 to 100.
psql -d partition <<EOF
  WITH locks as (
  SELECT pid,
         sum(case when fastpath = 't' then 1 else 0 end ) as num_fastpath_locks,
         sum(case when fastpath = 'f' then 1 else 0 end) as num_non_fastpath_locks
    FROM pg_locks
   WHERE locktype = 'relation'
   GROUP BY pid )
  SELECT a.pid, l.num_fastpath_locks, l.num_non_fastpath_locks, substr(a.query,1,100) as query
    FROM pg_stat_activity a JOIN locks l ON a.pid = l.pid
     AND a.pid != pg_backend_pid()
   order by 3 desc ;
EOF


 pid  | num_fastpath_locks | num_non_fastpath_locks |                         query
------+--------------------+------------------------+-------------------------------------------------------
 8490 |                  3 |                      0 | SELECT abalance FROM pgbench_accounts WHERE aid = $1;
 8505 |                  1 |                      0 | SELECT abalance FROM pgbench_accounts WHERE aid = $1;
 8511 |                  3 |                      0 | SELECT abalance FROM pgbench_accounts WHERE aid = $1;
 8523 |                  3 |                      0 | SELECT abalance FROM pgbench_accounts WHERE aid = $1;
You can observe that the query now holds only 3 Fast Path(FP) locks and zero non-Fast Path(NFP) locks.
psql -d partition <<EOF
  EXPLAIN ANALYZE SELECT abalance FROM pgbench_accounts WHERE aid = 5800001 ;
EOF

                                                                            QUERY PLAN
------------------------------------------------------------------------------------------------------------------------------------------------------------------
 Index Scan using pgbench_accounts_96_aid_idx on pgbench_accounts_96 pgbench_accounts  (cost=0.42..8.44 rows=1 width=4) (actual time=0.016..0.016 rows=1 loops=1)
   Index Cond: (aid = 5800001)
 Planning Time: 0.978 ms
 Execution Time: 0.048 ms
(4 rows)
PostgreSQL utilizes partition pruning to optimize query processing by accessing only the relevant partition, in this case, pgbench_accounts_96. PostgreSQL needs only relation locks on the partition, its associated index, and the parent table.
Conclusions
Overall, the Aurora PostgreSQL demonstrates effective scalability under increasing concurrent user loads when utilizing properly partitioned and optimal designed tables:
- Queries that don’t benefit from partition pruning can lead to significant NFP locking and lock manager contention and performance degradation issue, especially under higly concurrent workloads and high number of partitions.
- The well designed partition schema is critical to enabling PostgreSQL to scale effectively as workload increases.