
Problem statement
There are many mature and popular logging solutions on the market (Datadog, Logz.io, Splunk, etc), but they may be expensive for some companies, especially startups.
As log volumes increase, teams are often forced into tradeoffs. Shorter retention, reduced visibility, or unpredictable vendor-driven costs. Logging should scale like infrastructure, not like software licenses. Commercial logging platforms bundle pricing in ways that limit your ability to control costs as log volumes grow.
On the other hand, there are open-source and free solutions (e.g., OpenSearch, Graylog, Grafana Loki), but in this case, we should also consider deployment, availability, scalability, performance, and security, which increases our operational overhead.

An AWS-native approach gives you direct control over what you spend on ingestion, search, and retention, independently.
Automat-it’s Unified Log Platform offers an AWS-native alternative that separates short-term search from long-term retention, keeps all data inside your AWS account, and scales in a way security, finance, and engineering teams can plan for.
The solution delivers production-grade logging without enterprise overhead and is built using standardized, production-tested infrastructure-as-code patterns and leverages native AWS services:
- Amazon OpenSearch for short-term search and troubleshooting
- Amazon S3 and Glacier for long-term retention
- Amazon Athena for on-demand analytics
- Kinesis Data Firehose with AWS Lambda for scalable ingestion and normalization
Solution overview
All deployed within your AWS account, infrastructure you own and control, to deliver a secure and operationally consistent logging platform.
The platform provides operational monitoring with pre-configured dashboards, intelligent storage tiering, and native integration with CloudWatch, VPC Flow Logs, EKS control plane logging, and AWS security services, allowing teams to deploy production-ready observability in days. Organizations maintain complete control over their data and infrastructure while supporting compliance posture and benefiting from seamless integration with Kubernetes and security tools.
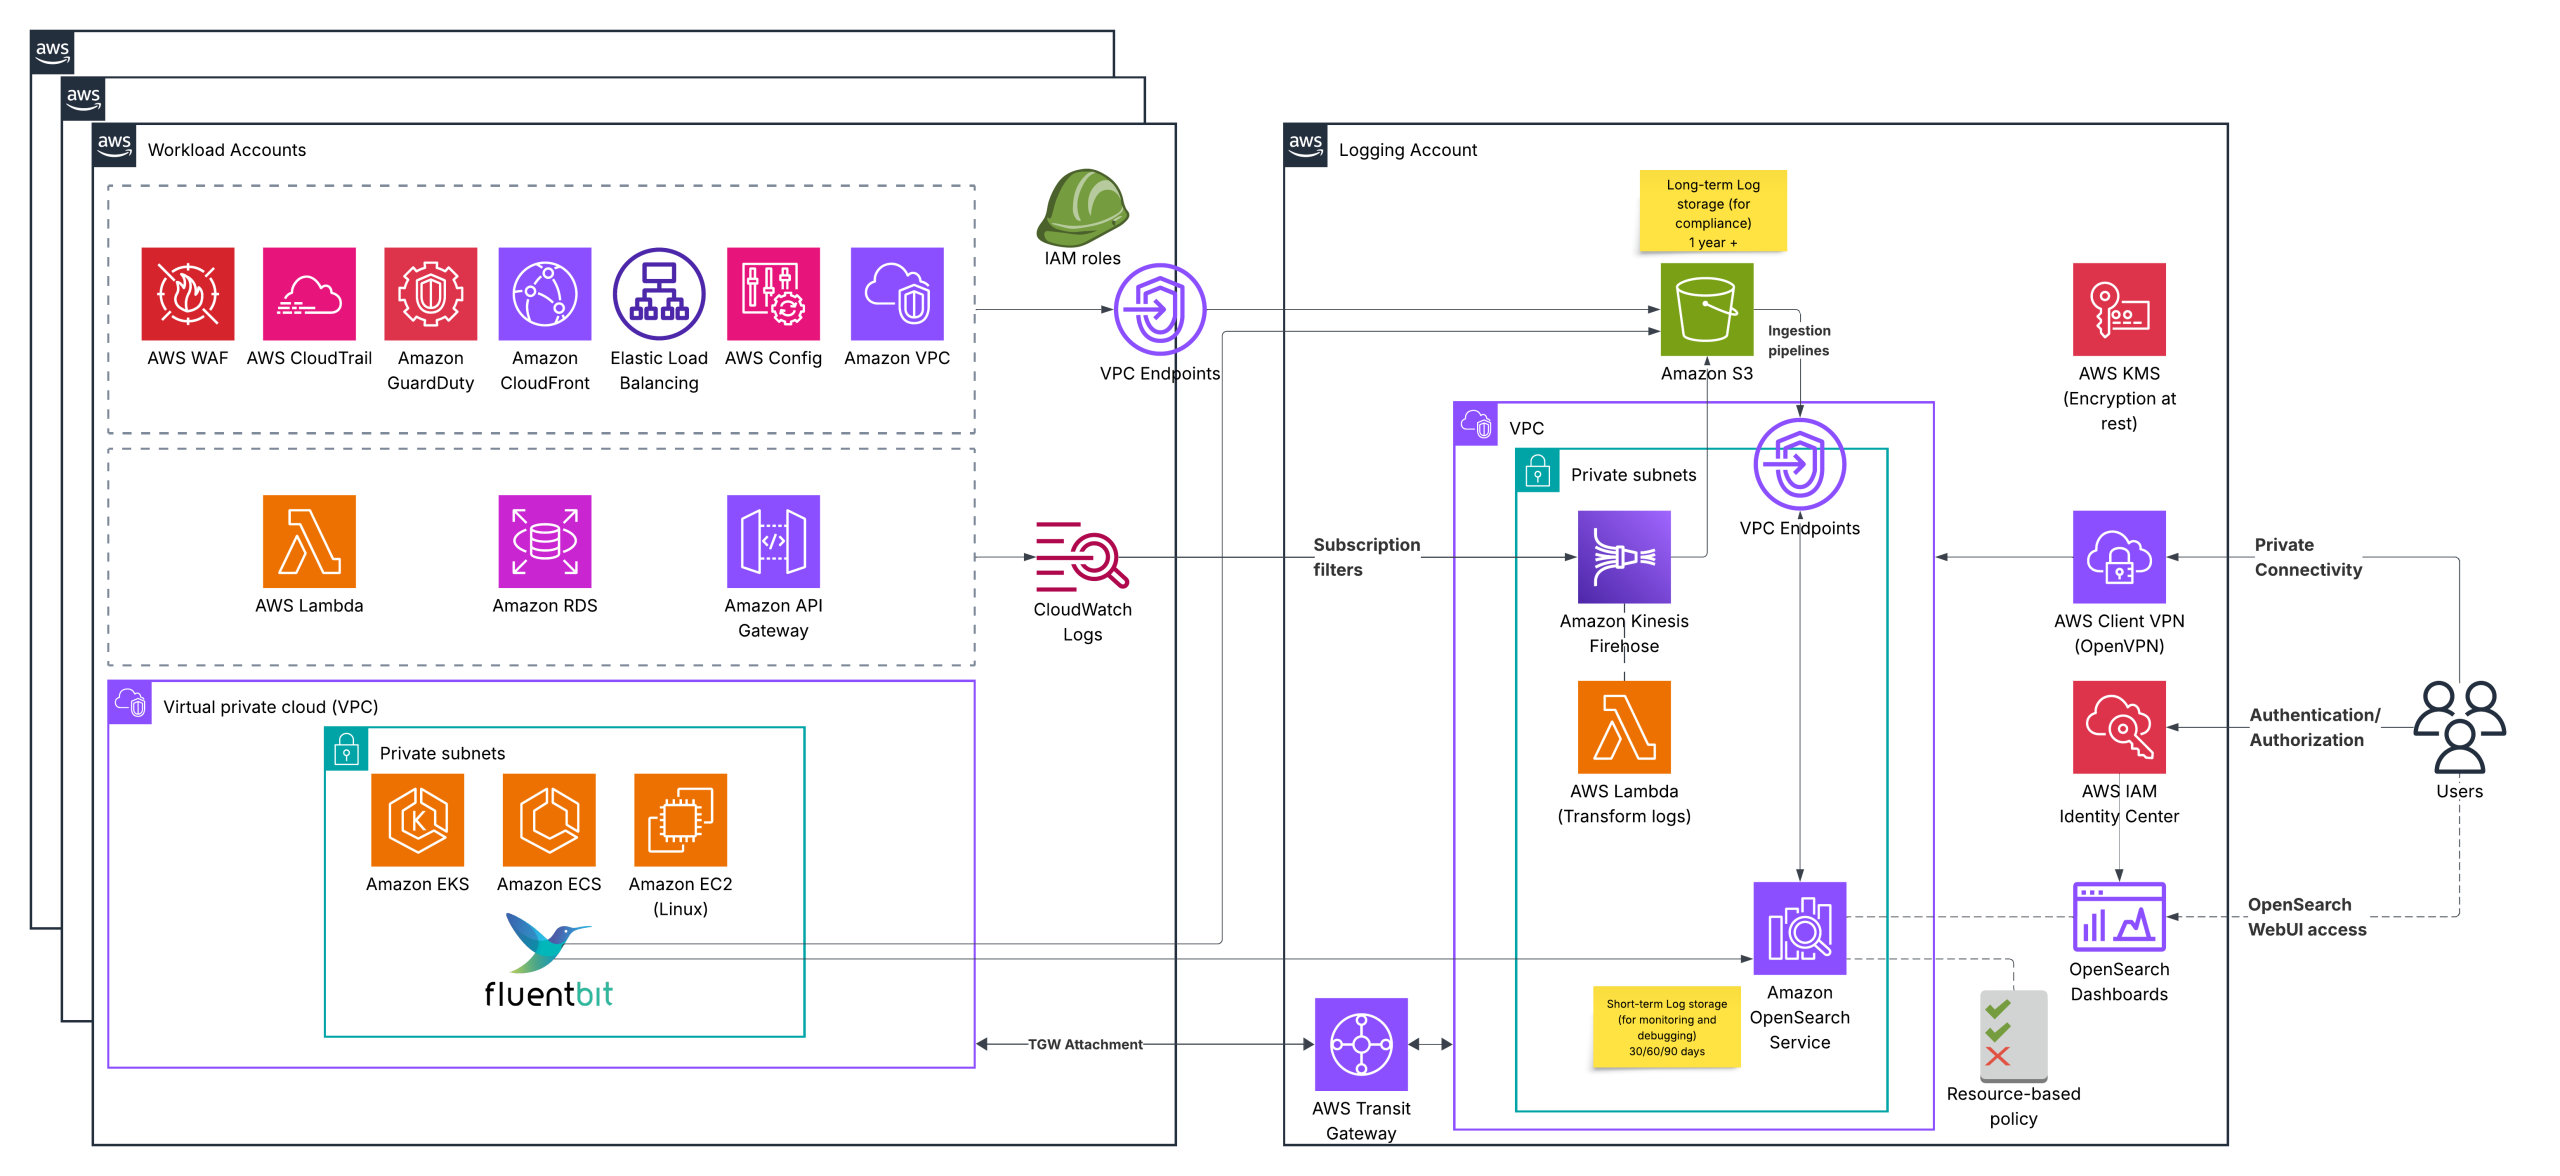
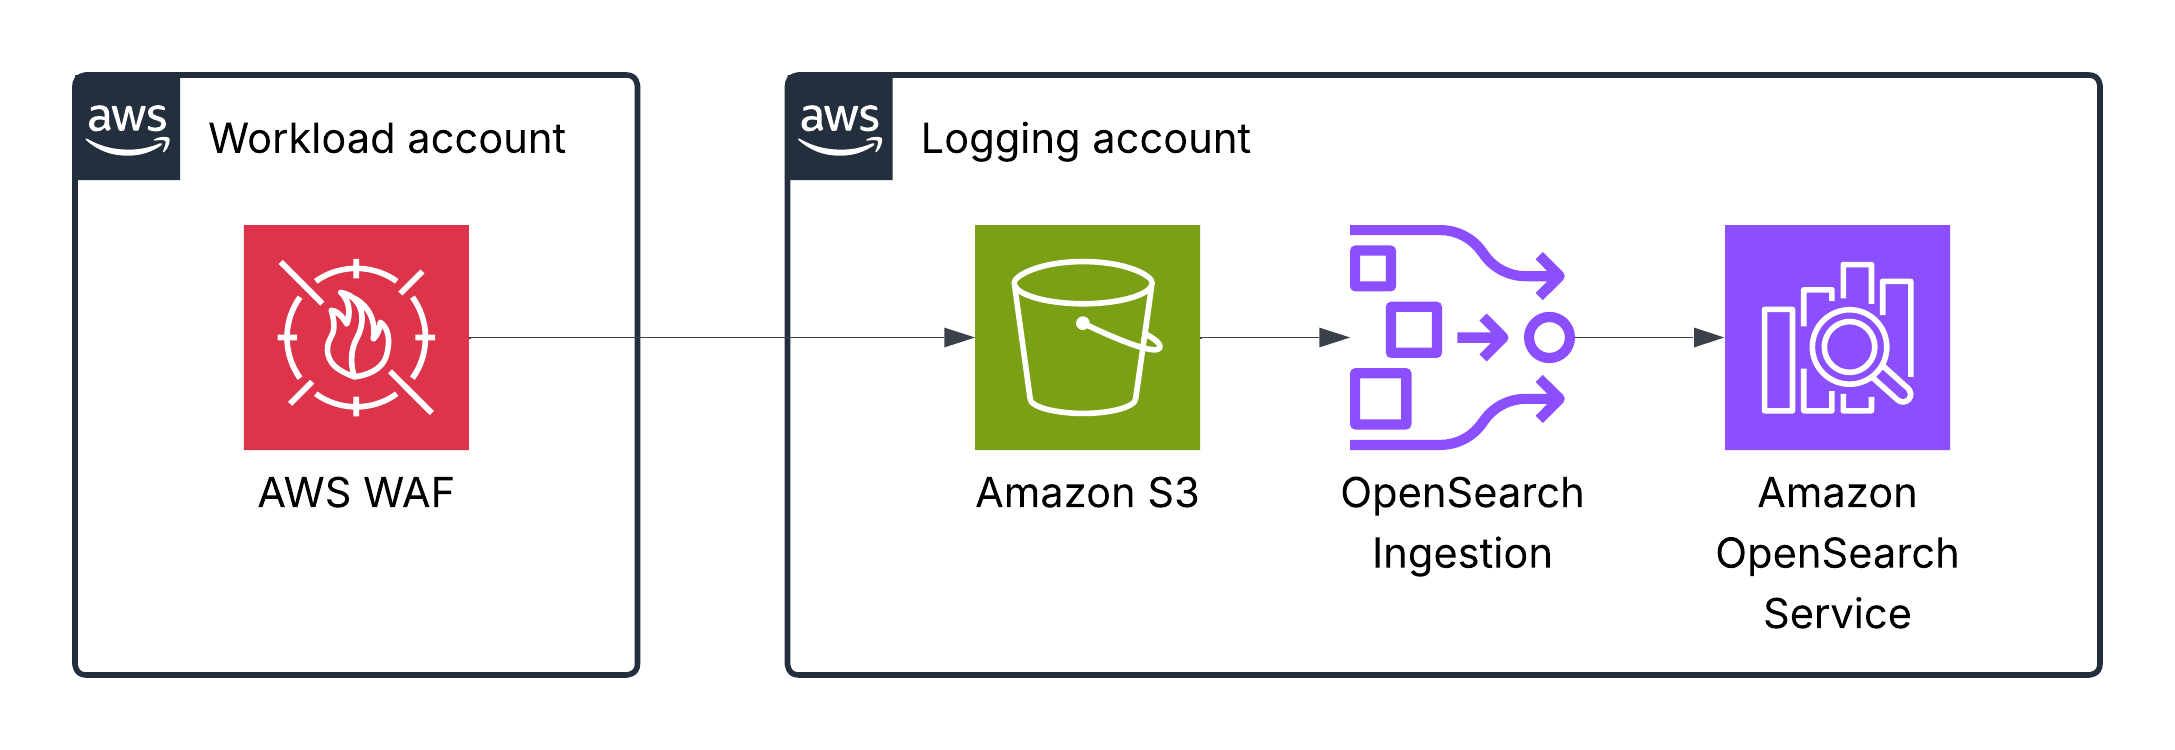
- The solution works in a multi-account AWS environment to provide isolation and security.
- Support the most popular AWS services as a log source.
- Store logs in an isolated, secure S3 bucket for long-term storage (e.g., 1–3 years), required for compliance, while the OpenSearch cluster stores short-term logs (e.g., 1–3 months) for monitoring and troubleshooting. This ensures cost-effectiveness.
- Follow the best security practices (data is encrypted “at rest” and “in transit”, the principle of least privilege, and private network connectivity).
Logs ingestion and visualization
Log sources in our case can be divided into three classes:
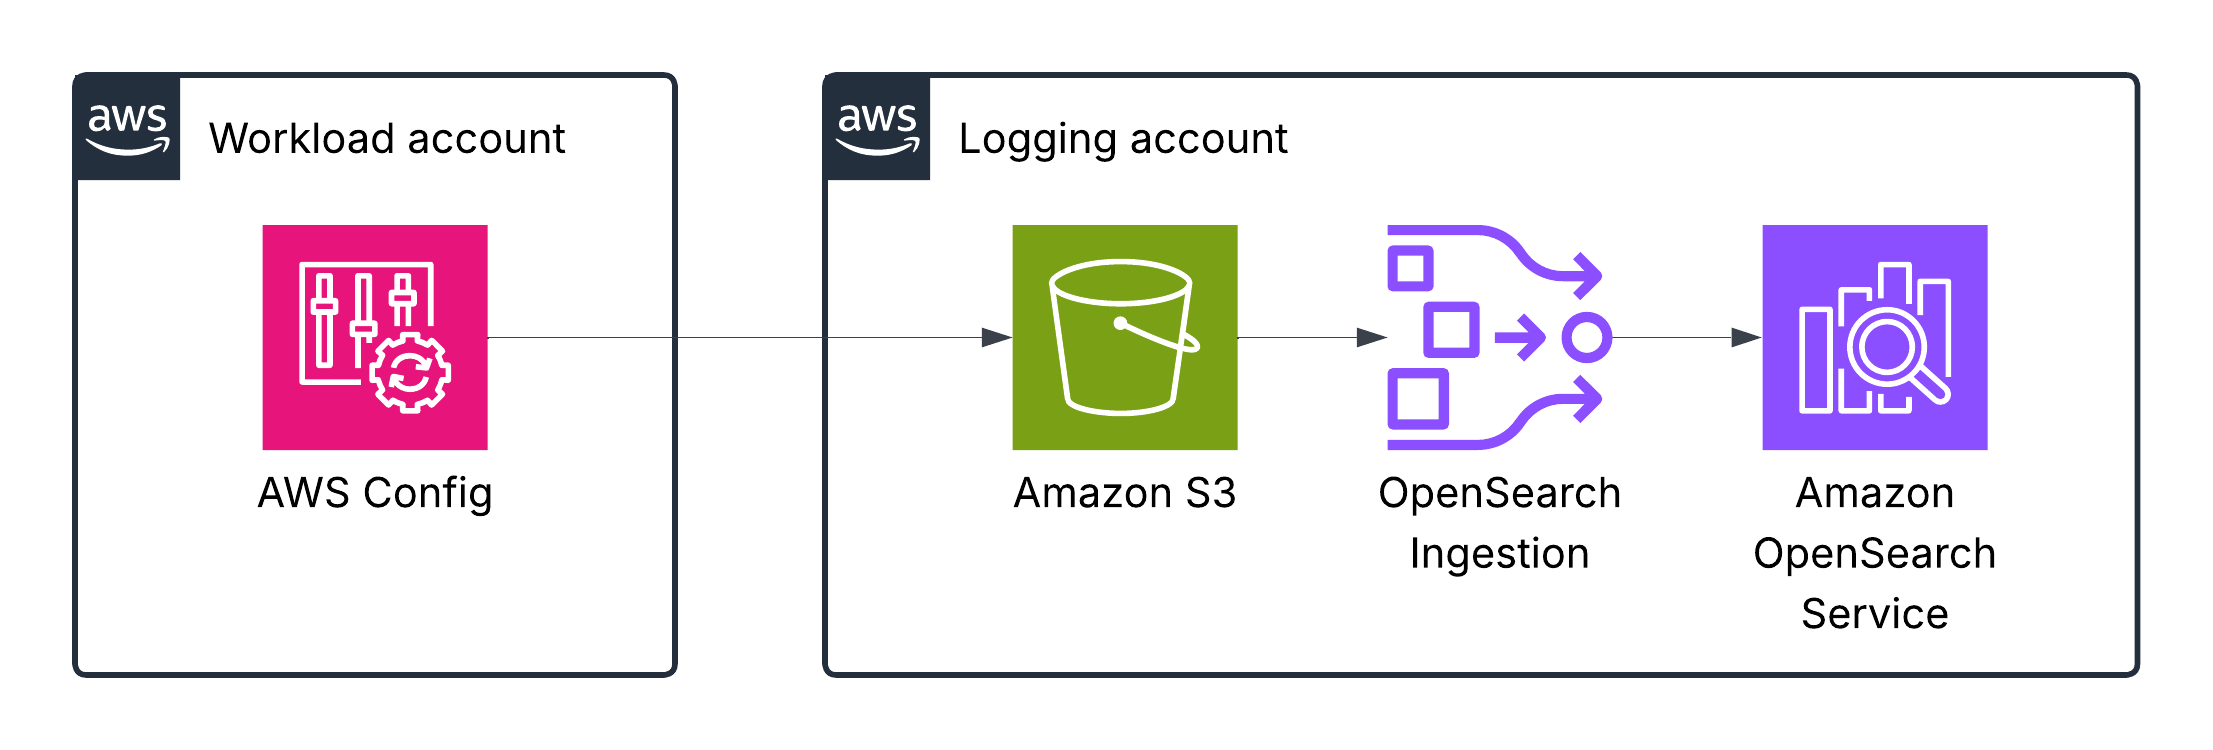
- AWS services, which can write logs directly to an S3 bucket (AWS WAF, AWS CloudTrail, GuardDuty, CloudFront, ELB, AWS Config, VPC)
- AWS services, which can write logs into Cloudwatch logs only (AWS Lambda, RDS event logs, Amazon API Gateway)
- Applications and workloads (containerized or VM-based), where we can use an agent such as FluentBit to send logs to the appropriate destinations.
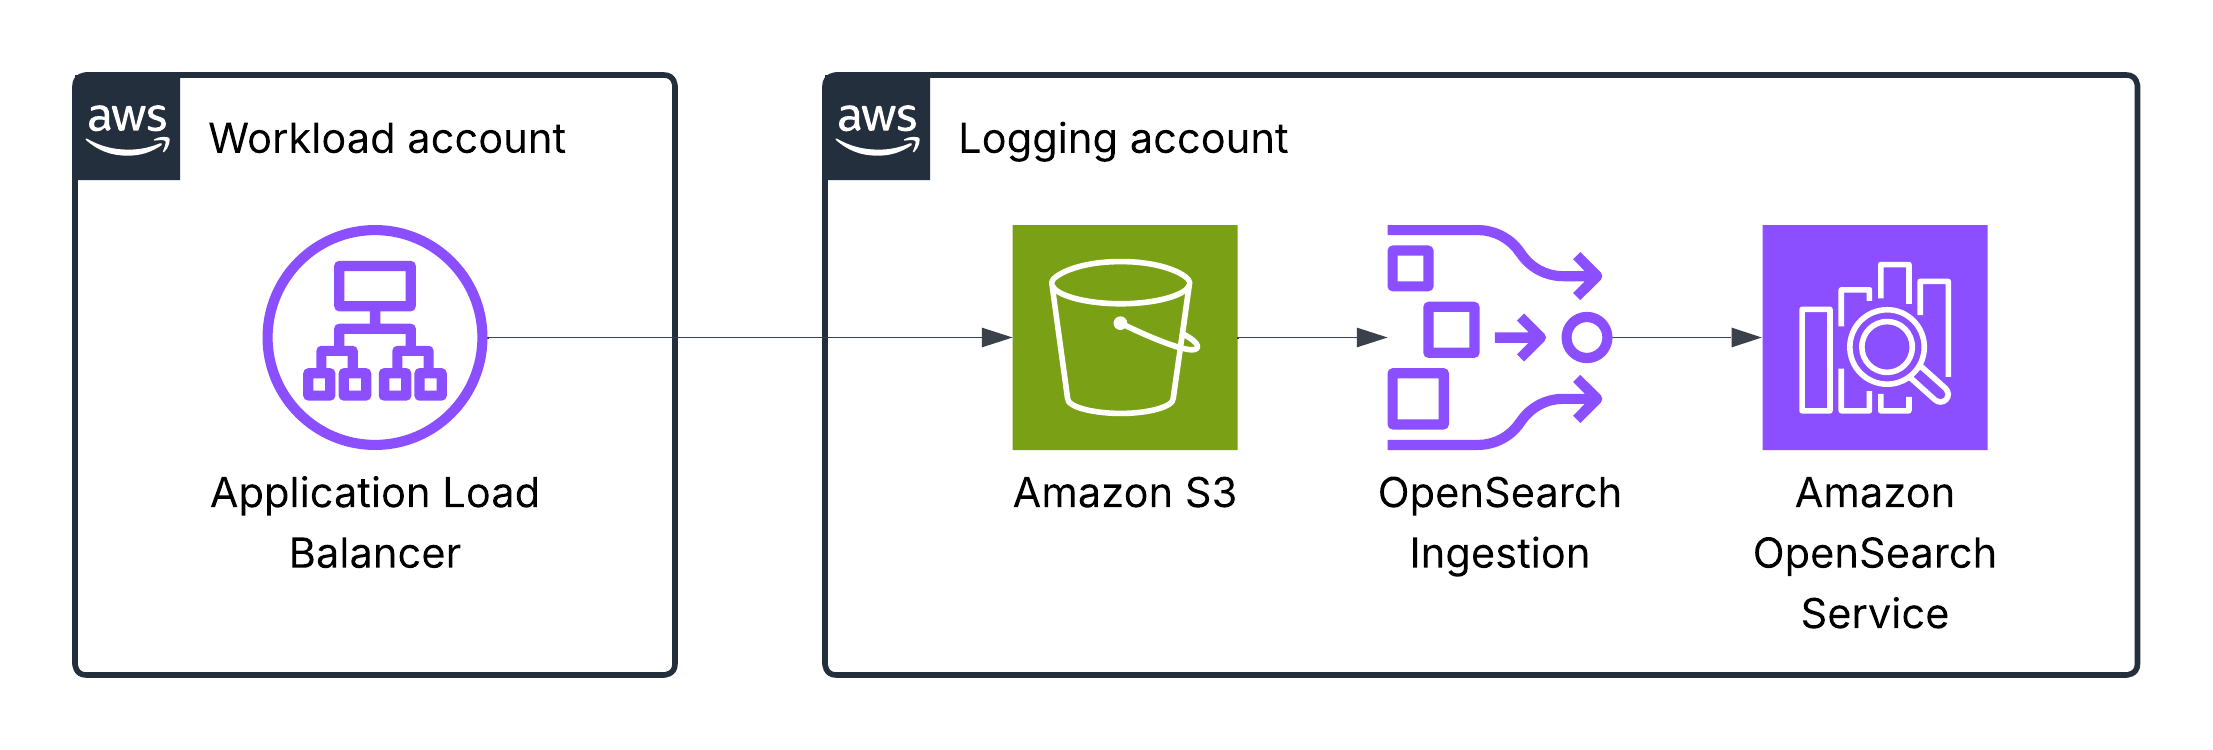
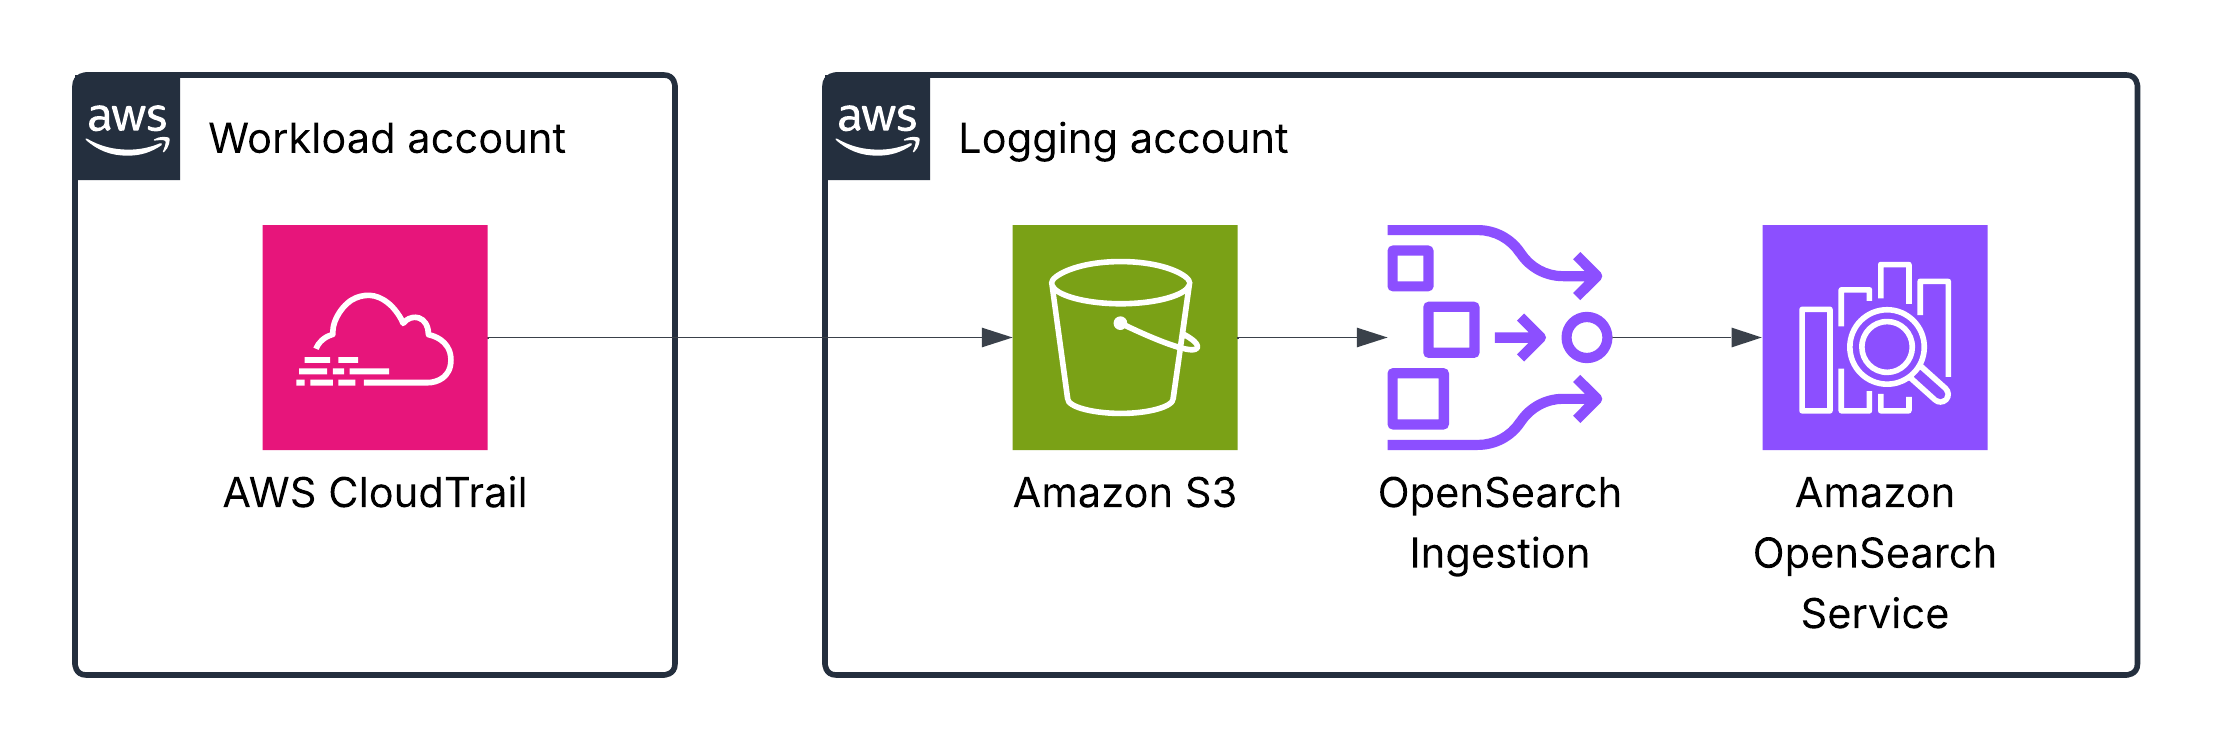
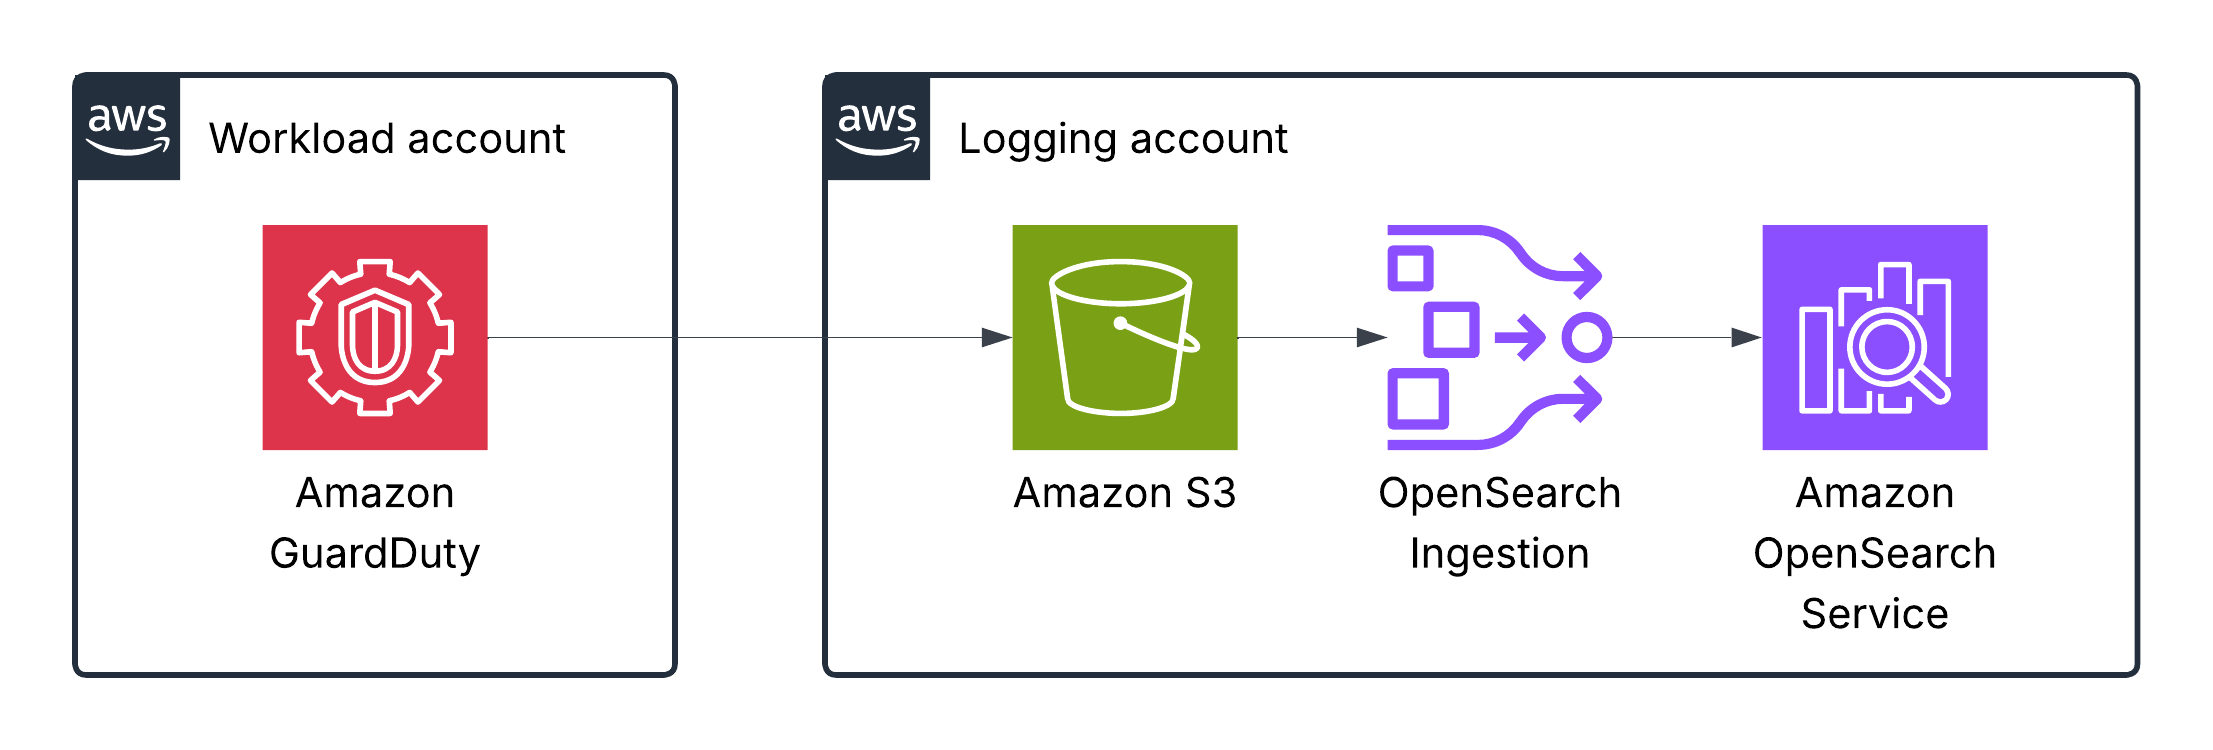
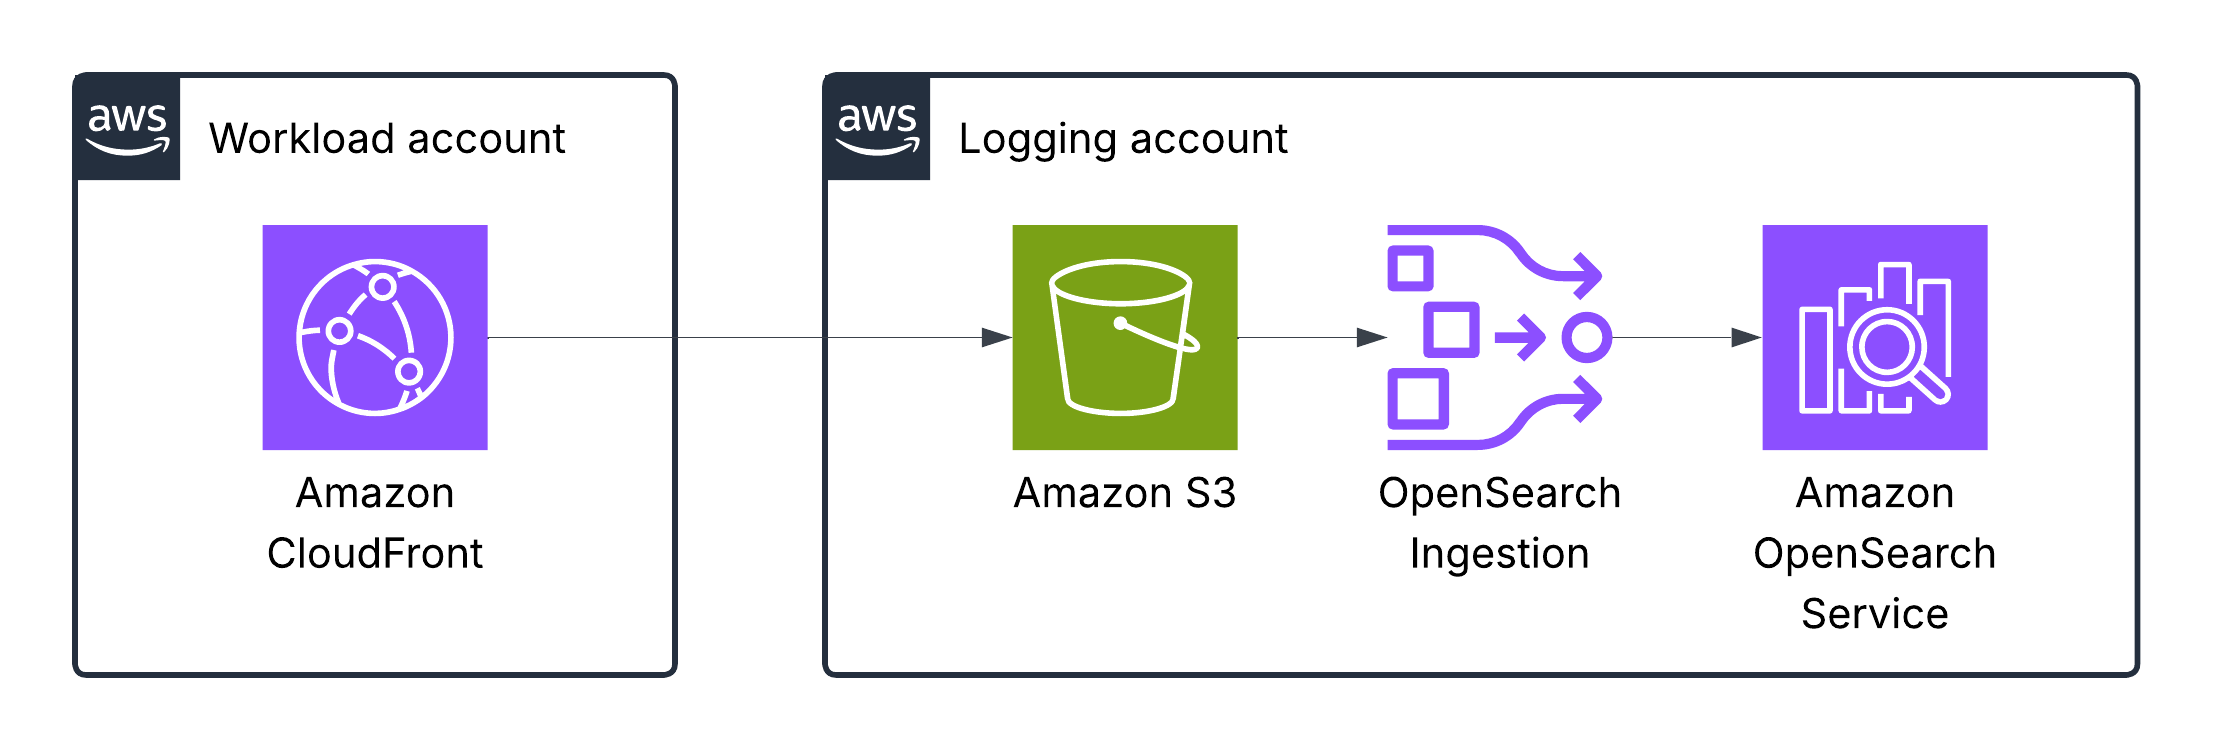
Once logs are stored in an S3 bucket for long-term, they are ingested into OpenSearch using Ingestion pipelines.
Let’s look at specific examples
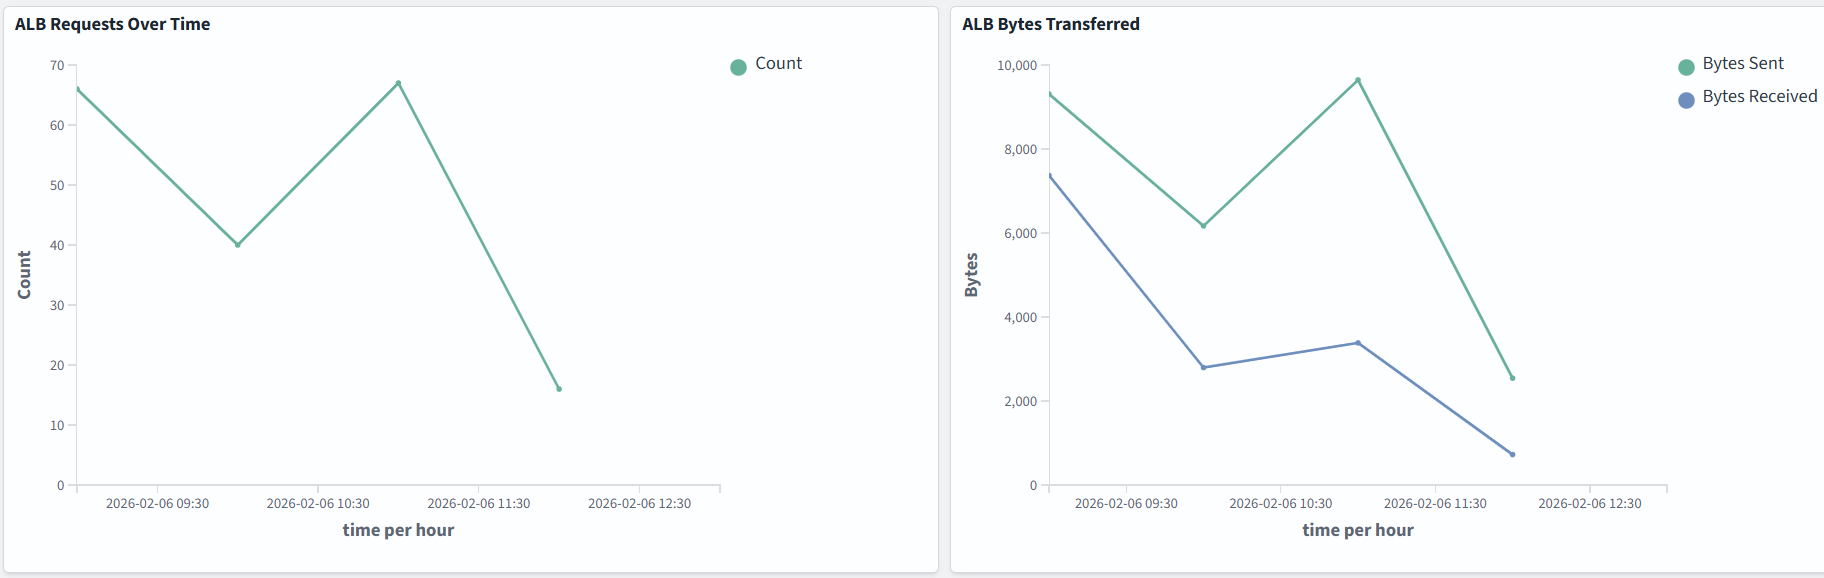
Application Load Balancer logs
Elastic Load Balancing publishes a log file for each load balancer node every 5 minutes. Log delivery is eventually consistent. The load balancer can deliver multiple logs for the same period. This usually happens if the site has high traffic.
This table in AWS docs describes the fields of an access log entry in order.
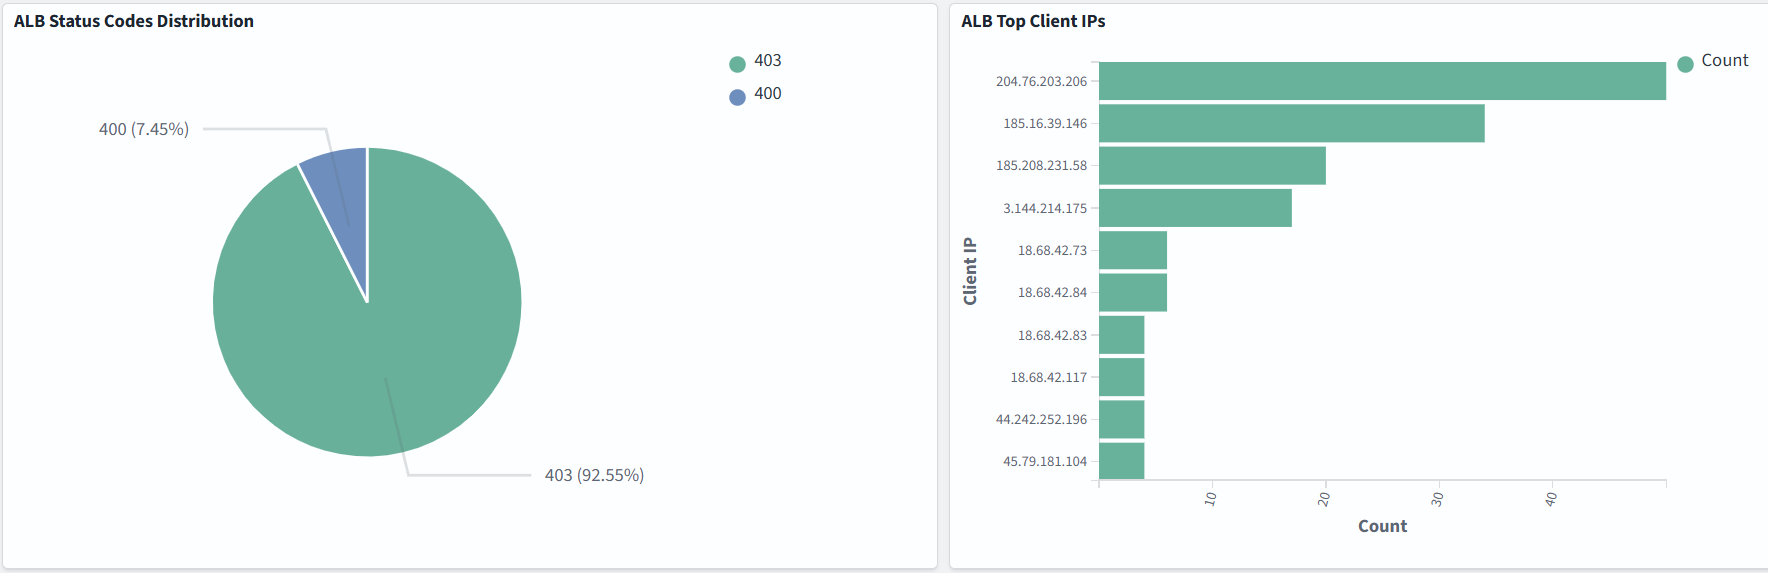
Dashboard samples are available here, but you can also build your own to suit your needs. In the example below, we monitor ALB Status Codes Distribution, ALB Top Client IPs, the number of requests, and bytes transferred:
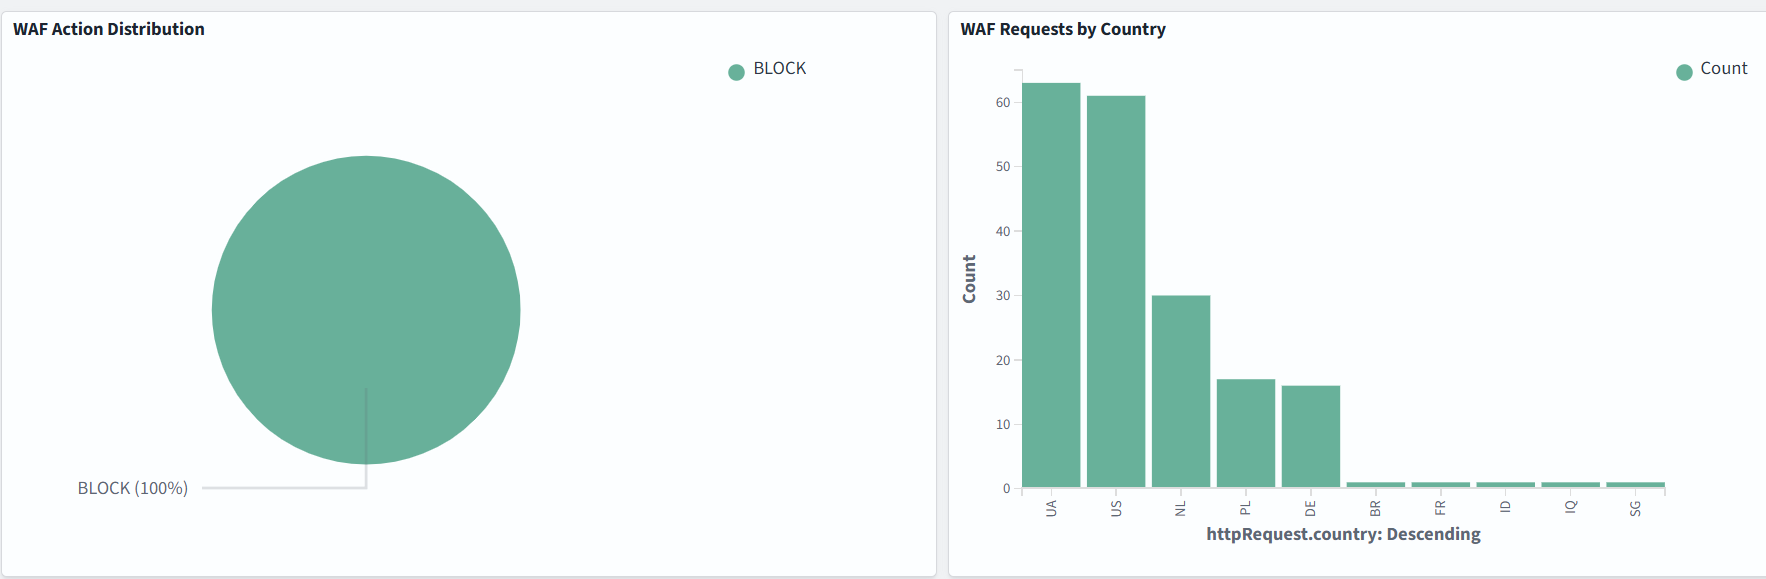
AWS WAF logs
AWS WAF log information includes the time that AWS WAF received a web request from your AWS resource, detailed information about the request, and details about the rules that the request matched.
This table in the AWS docs describes the fields of the WAF log entry.
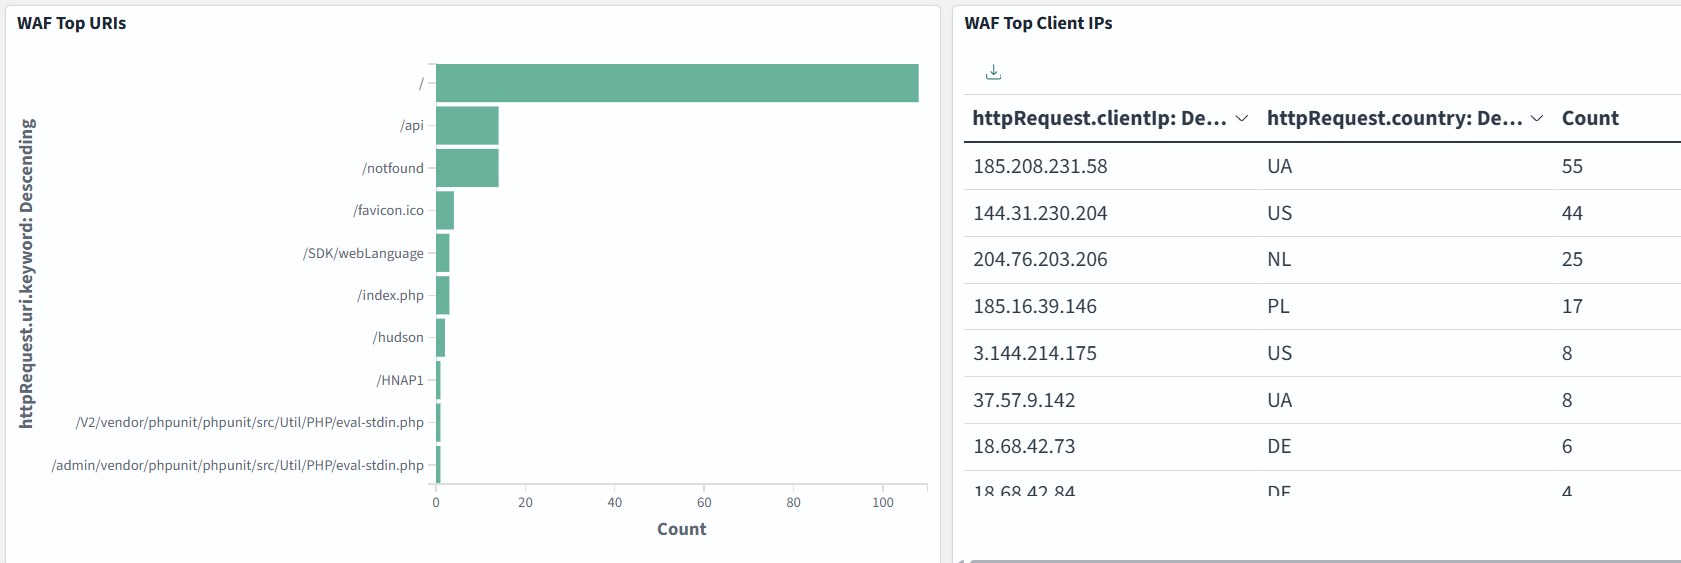
Dashboard samples are available here, but you can also build your own to suit your needs. In the example below, we monitor WAF Action Distribution, Requests by Country, Top URIs, and Top Client IPs:
AWS CloudTrail logs
When an event occurs in your account, CloudTrail evaluates whether the event matches the settings for your trails. Only events that match your trail settings are delivered to the S3 bucket
This table in AWS docs describes the fields of a CloudTrail log entry.
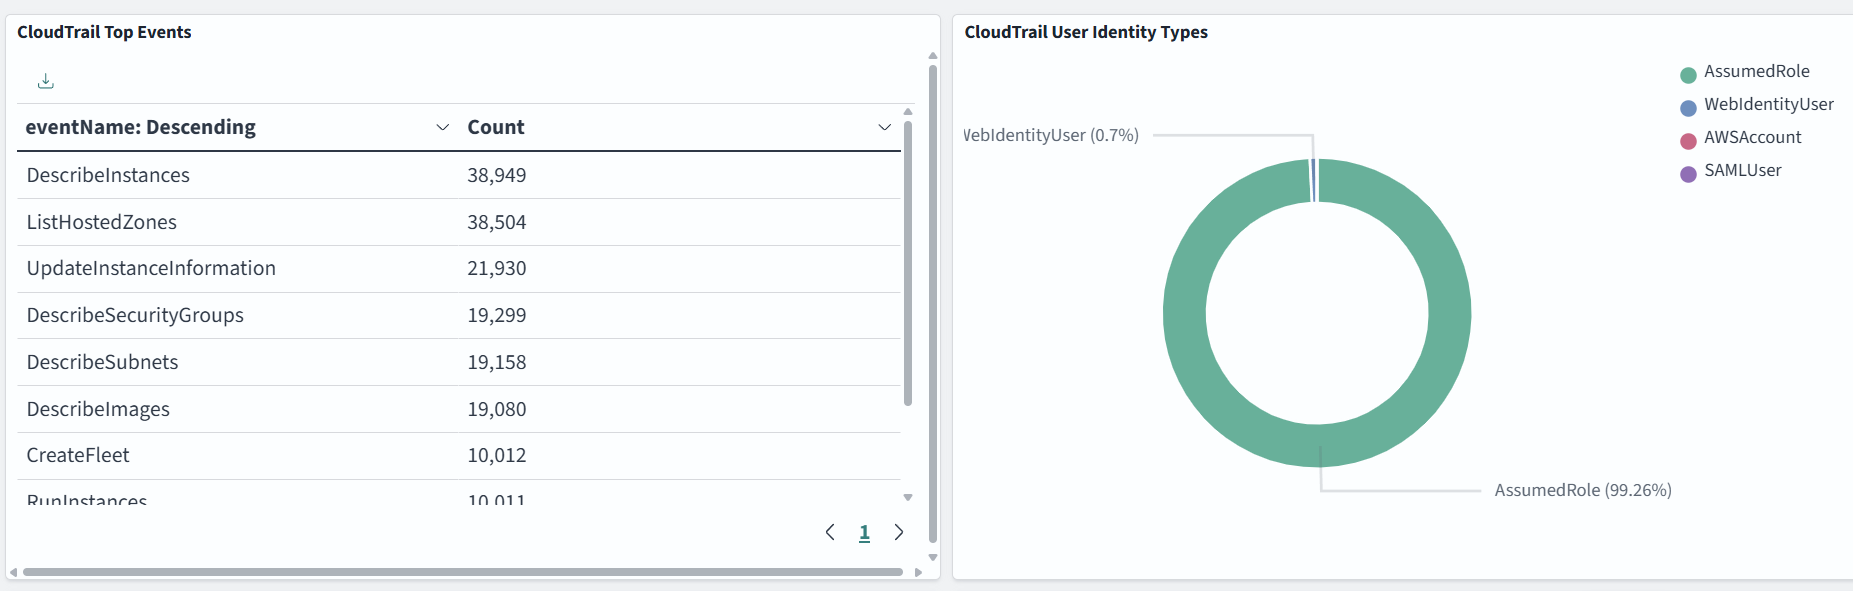
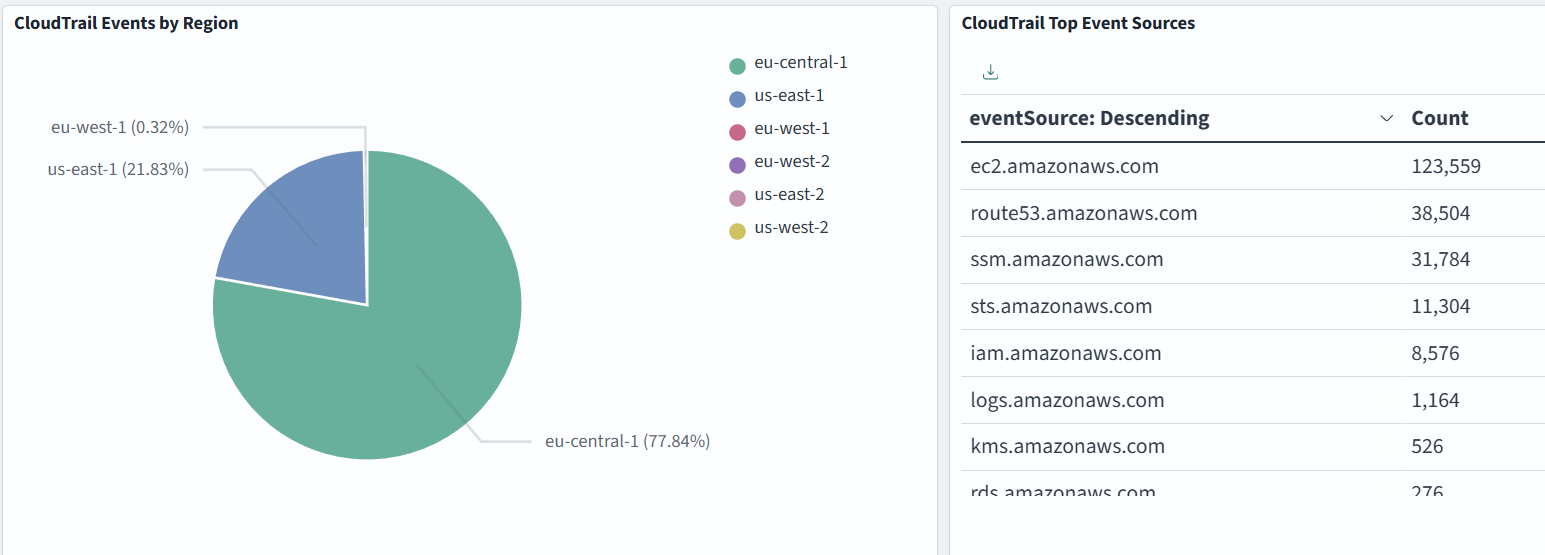
Dashboard samples are available here, but you can also build your own to suit your needs. In the example below, we monitor CloudTrail Top Events, User Identity Types, Events by Region, and Top Event Sources:
Amazon GuardDuty logs
GuardDuty can optionally export the generated findings to an Amazon Simple Storage Service (Amazon S3) bucket. This will help you track historical data on potentially suspicious activities on your account and evaluate whether the recommended remediation steps were successful.
This table in AWS docs describes the fields of a GuardDuty finding log.
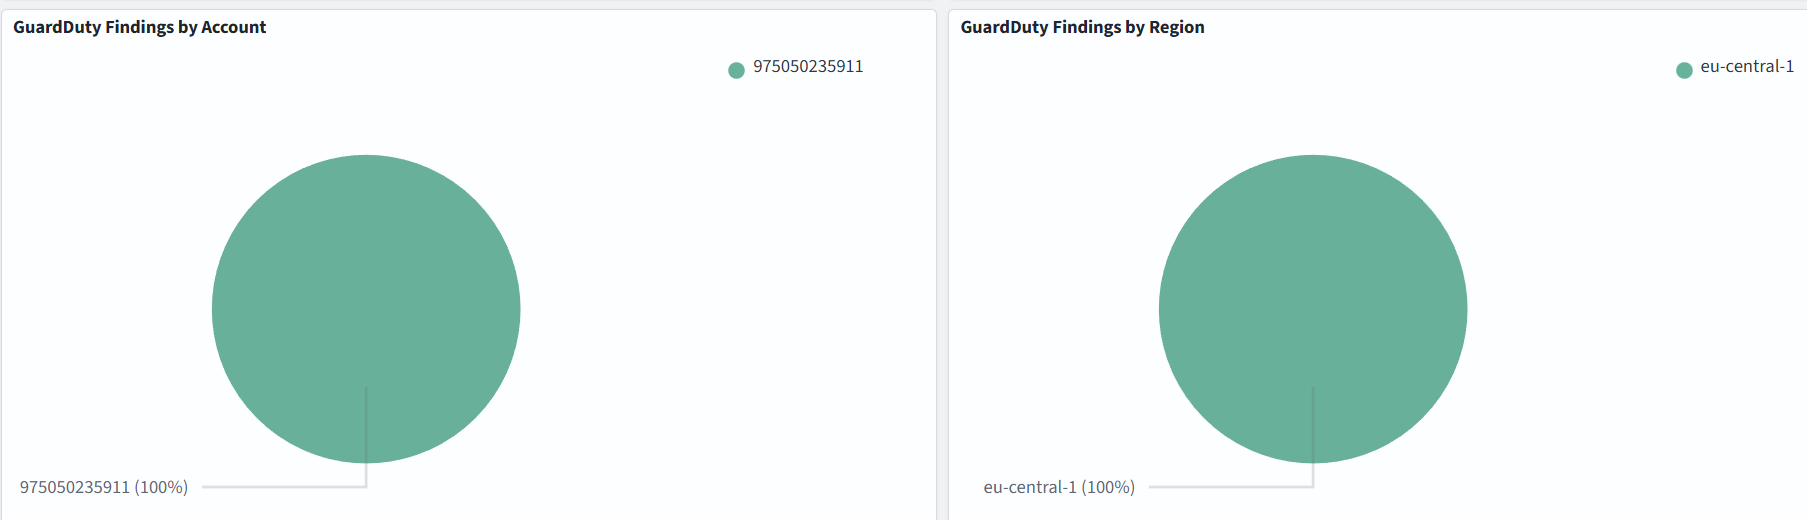
Dashboard samples are available here, but you can also build your own to suit your needs. In the example below, we monitor GuardDuty Severity Distribution, Top Finding Types, Findings by Account and by Region:
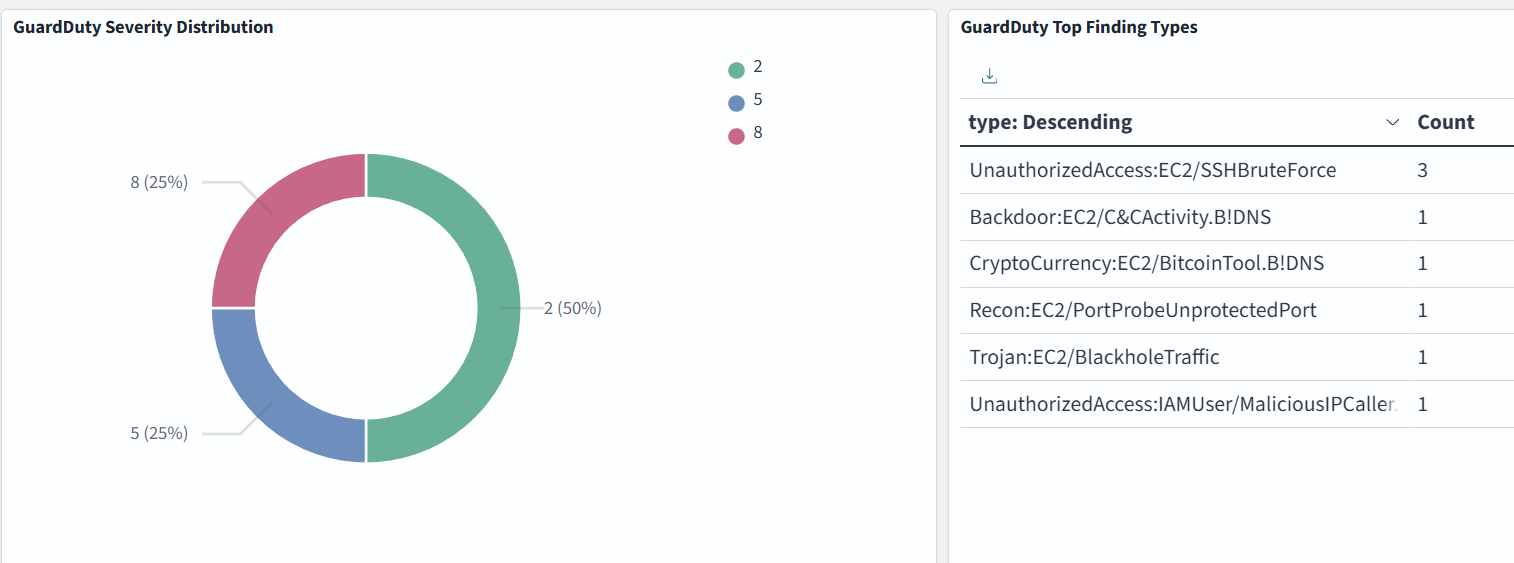
Severity levels of GuardDuty findings:
- High severity: 7.0–8.9
- Medium severity: 4.0–6.9
- Low severity: 1.0–3.9
Amazon CloudFront logs
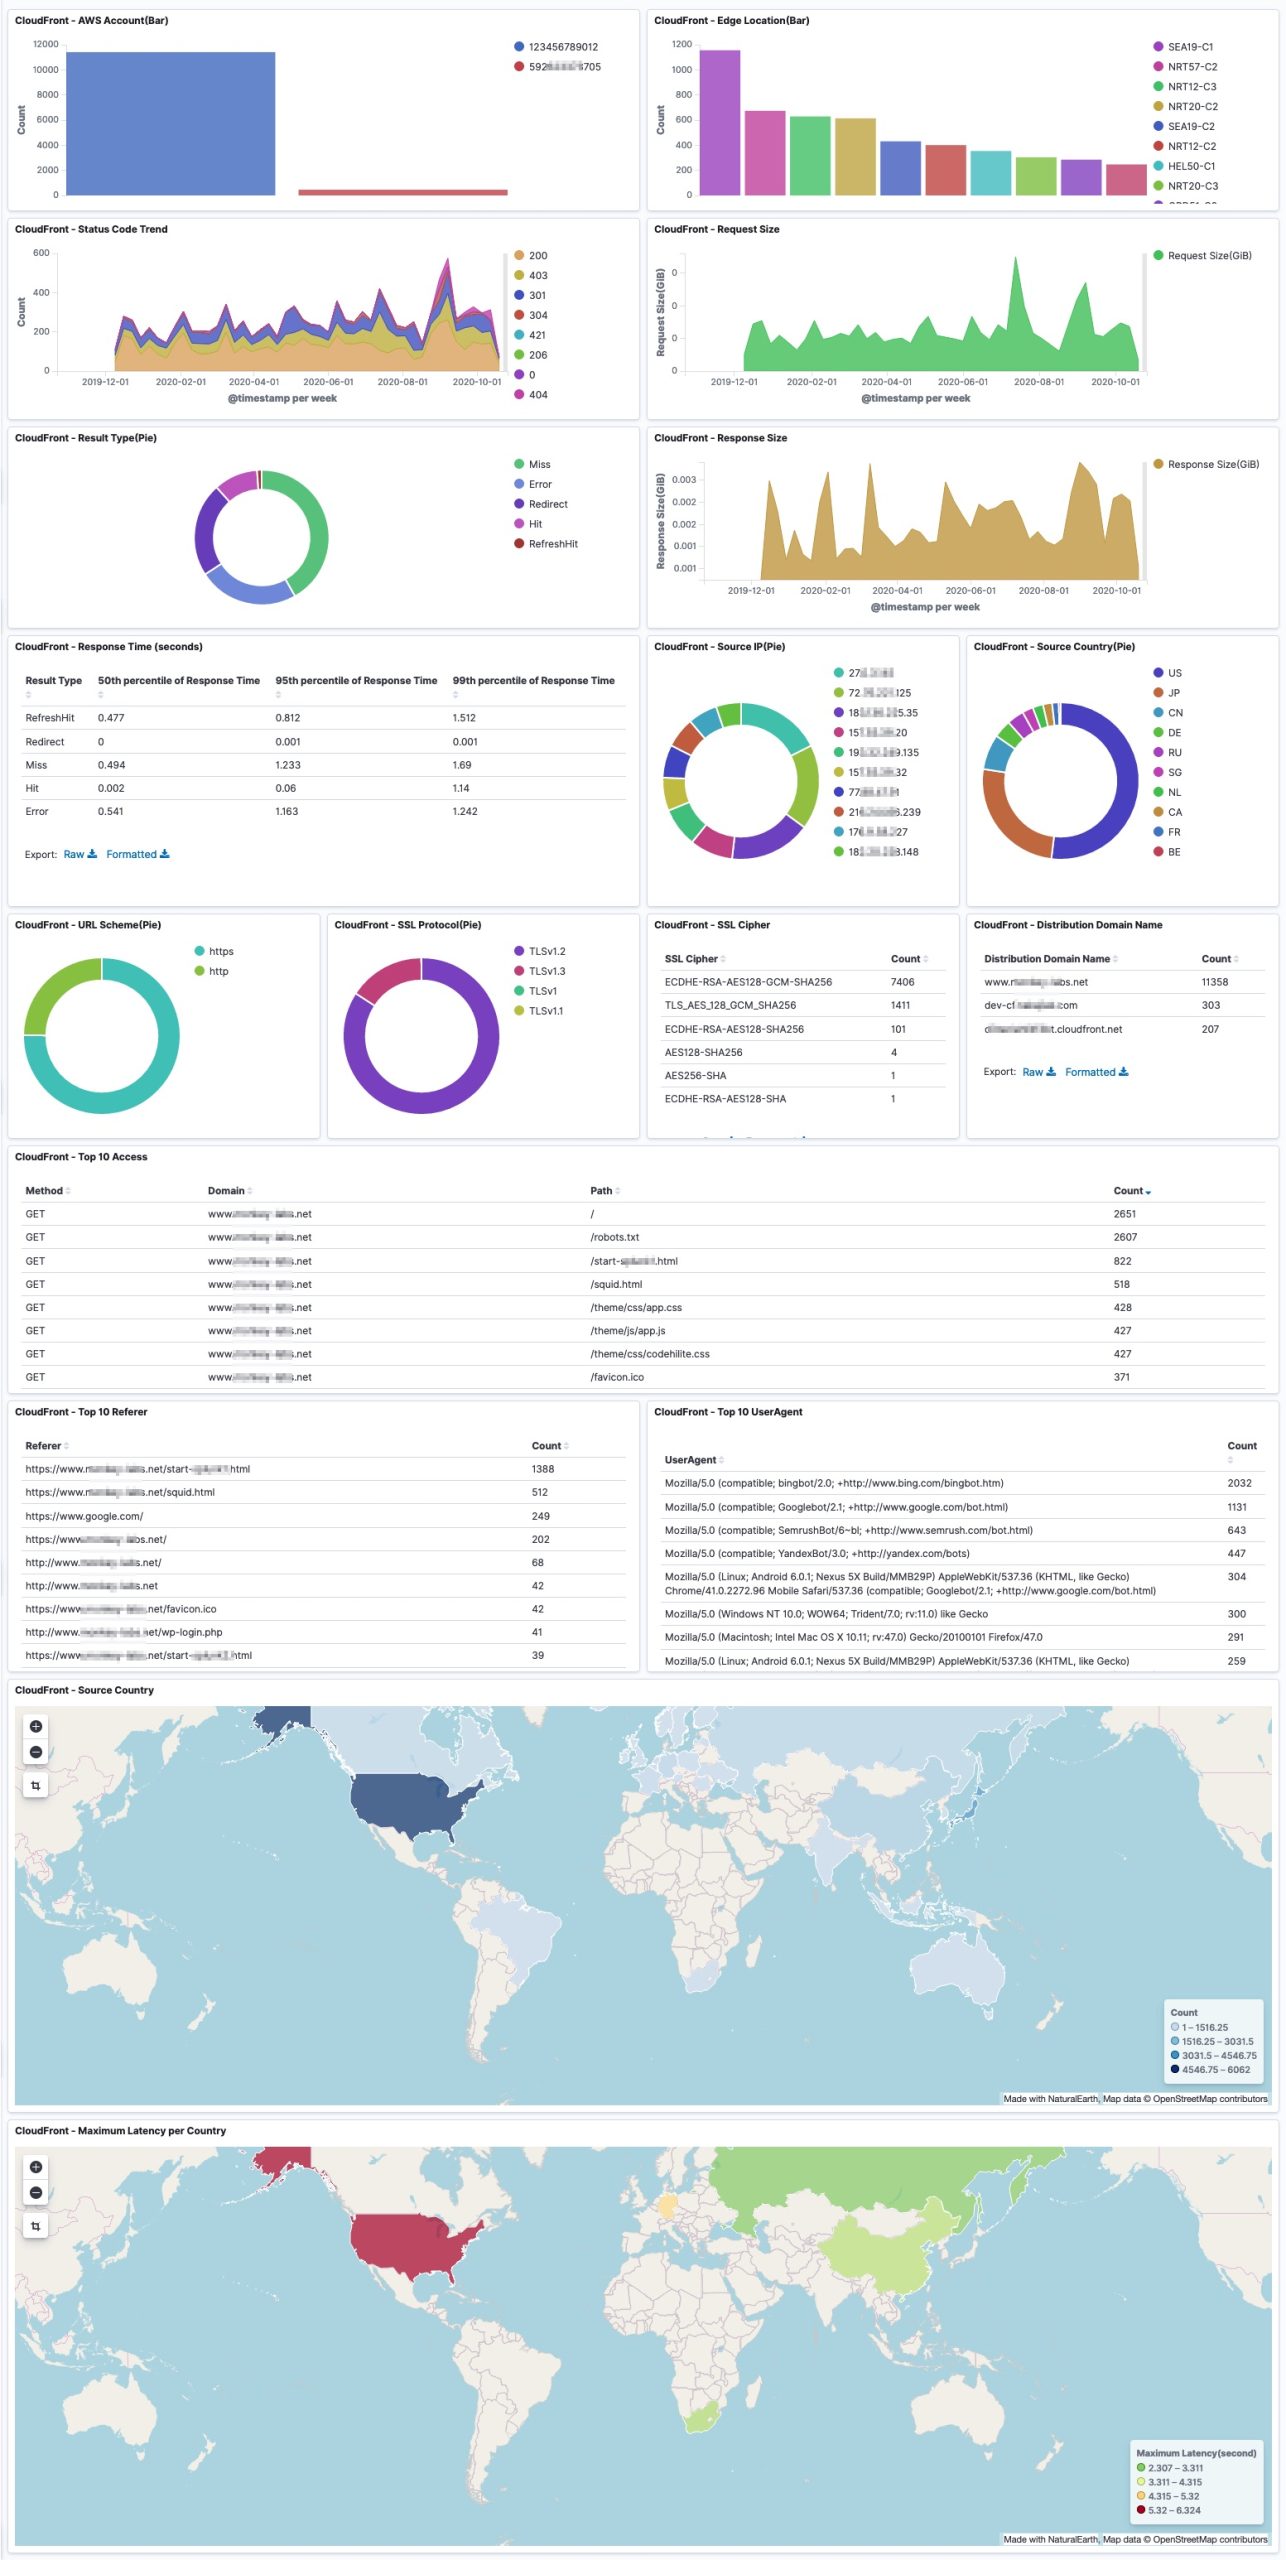
CloudFront log files contain detailed information about every user (viewer) request that CloudFront receives. These are called access logs, also known as standard logs. Each log contains information such as the time the request was received, the processing time, request paths, and server responses. You can use these access logs to analyze response times and to troubleshoot issues.
This table in AWS docs describes the fields of a CloudFront log.
Dashboard samples are available here, but you can also build your own to suit your needs. The dashboard example is below:
AWS Config logs
AWS Config tracks changes to the configuration of your AWS resources and regularly sends updated configuration details to an Amazon S3 bucket you specify. For each resource type that AWS Config records, it sends a configuration history file every six hours. Each configuration history file contains details about the resources that changed in that six-hour period. Each file includes resources of one type, such as Amazon EC2 instances or Amazon EBS volumes. If no configuration changes occur, AWS Config does not send a file.
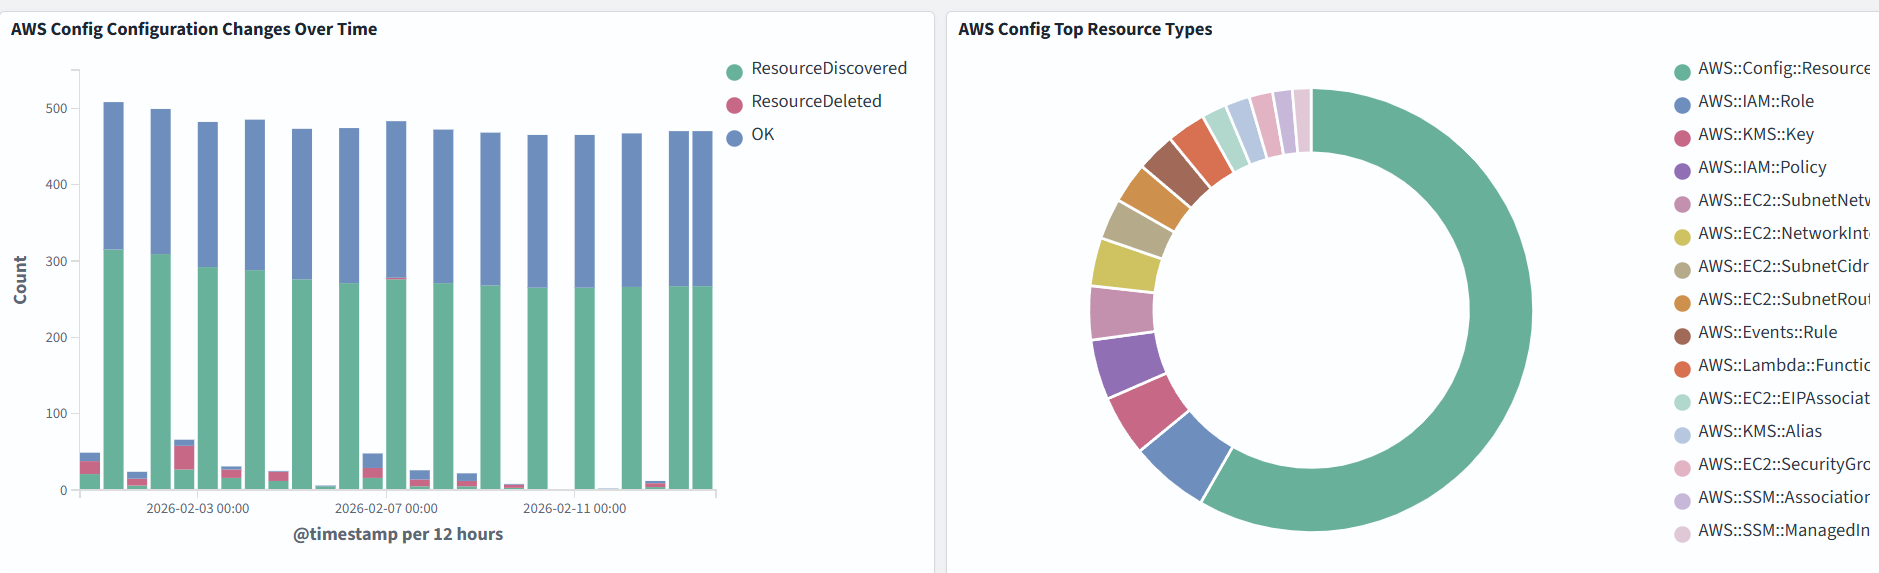
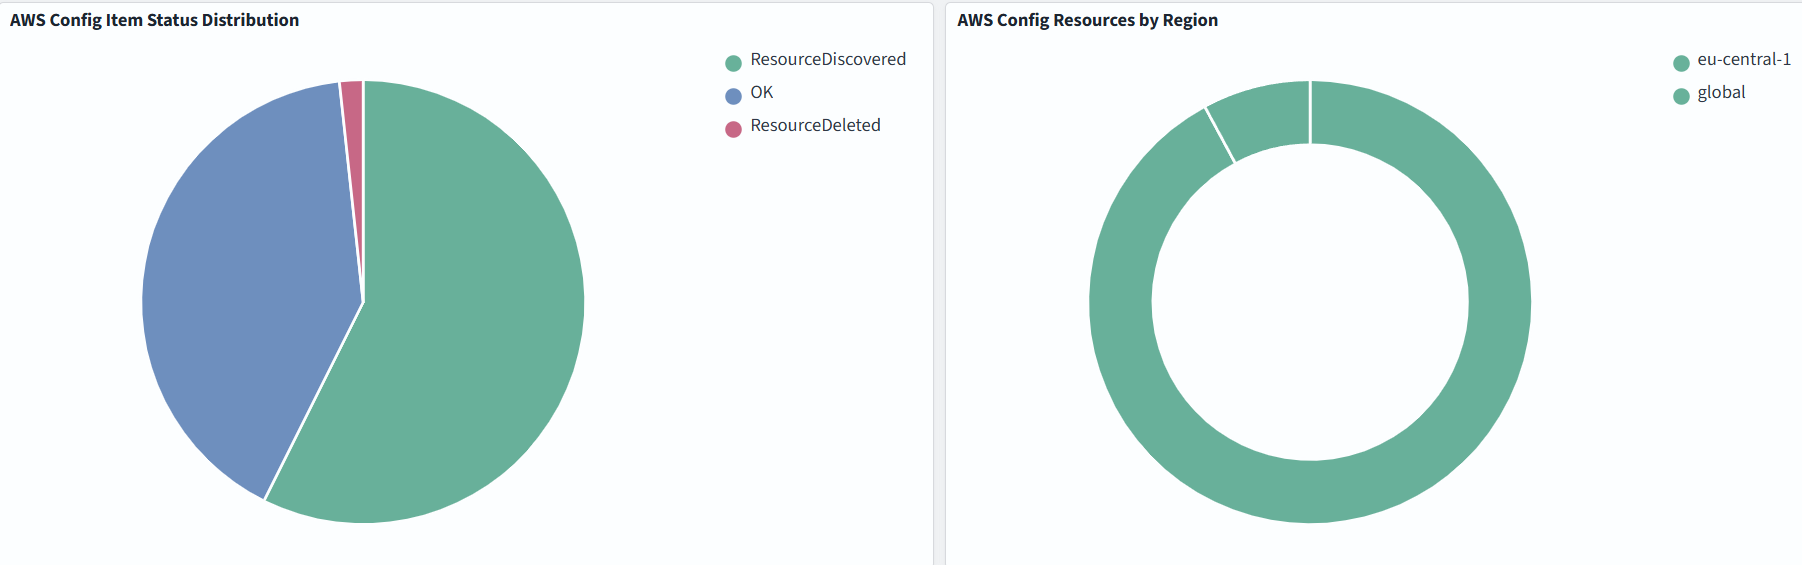
This table in AWS docs describes the fields of an AWS Config log.
In the example below, we monitor Configuration Changes Over Time, Top Resource Types, Resources by Region:
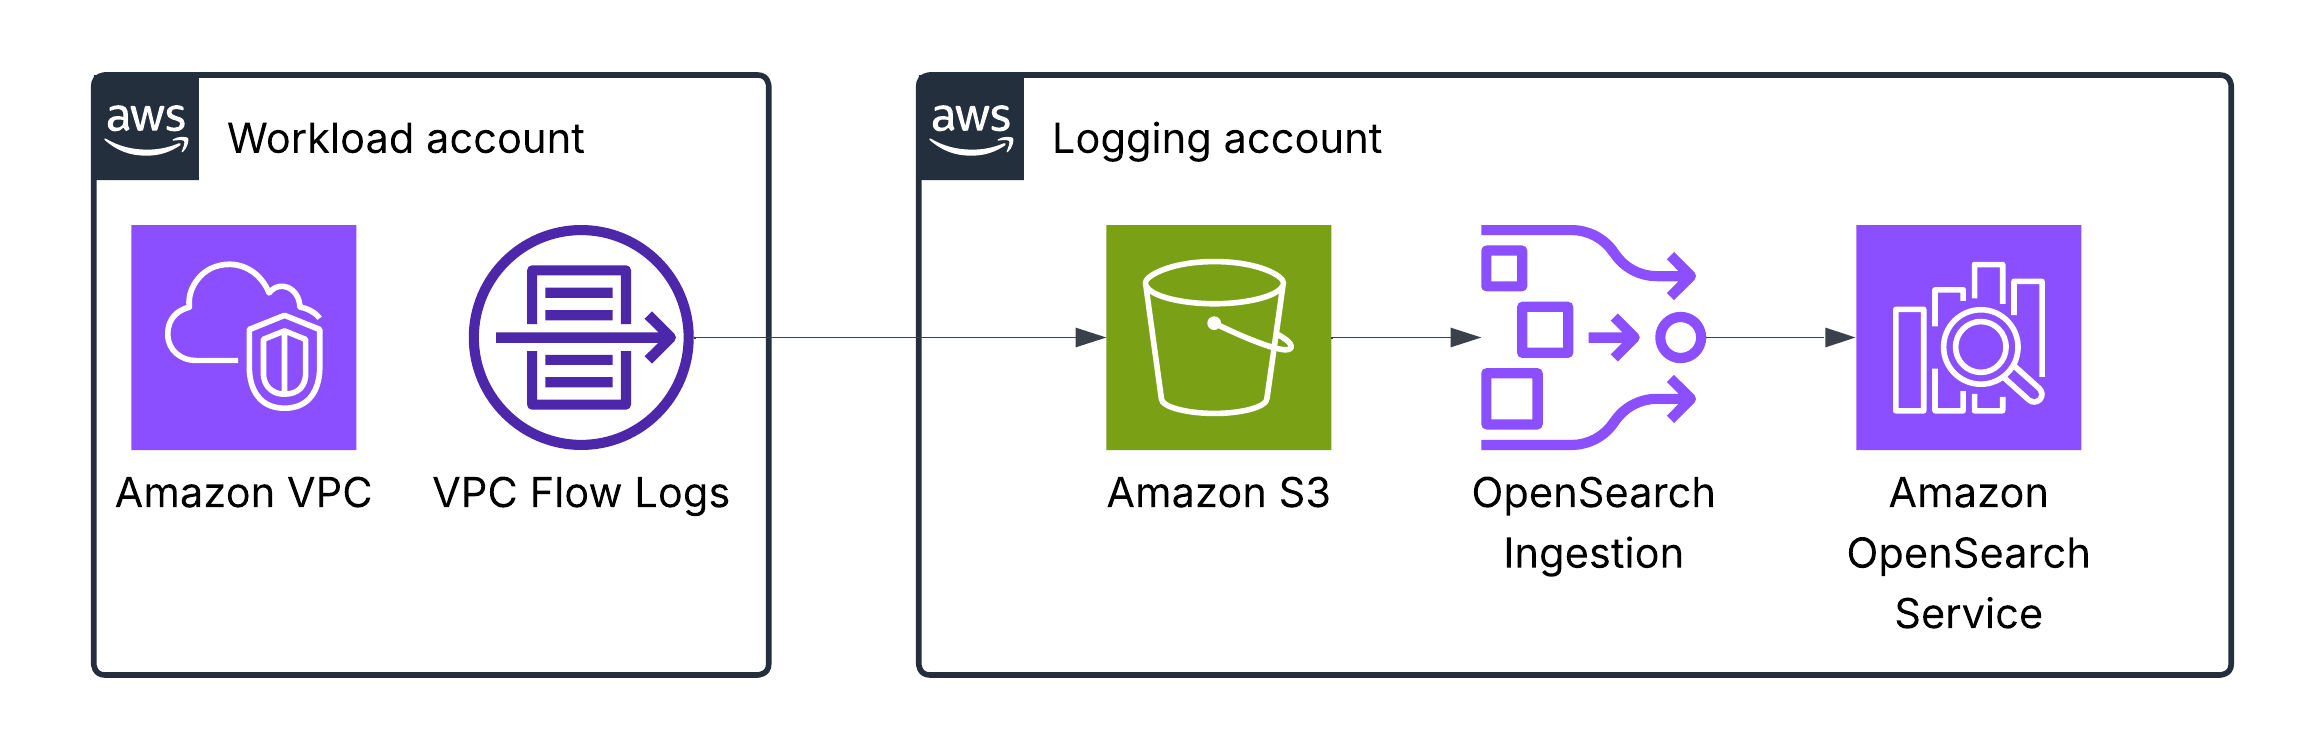
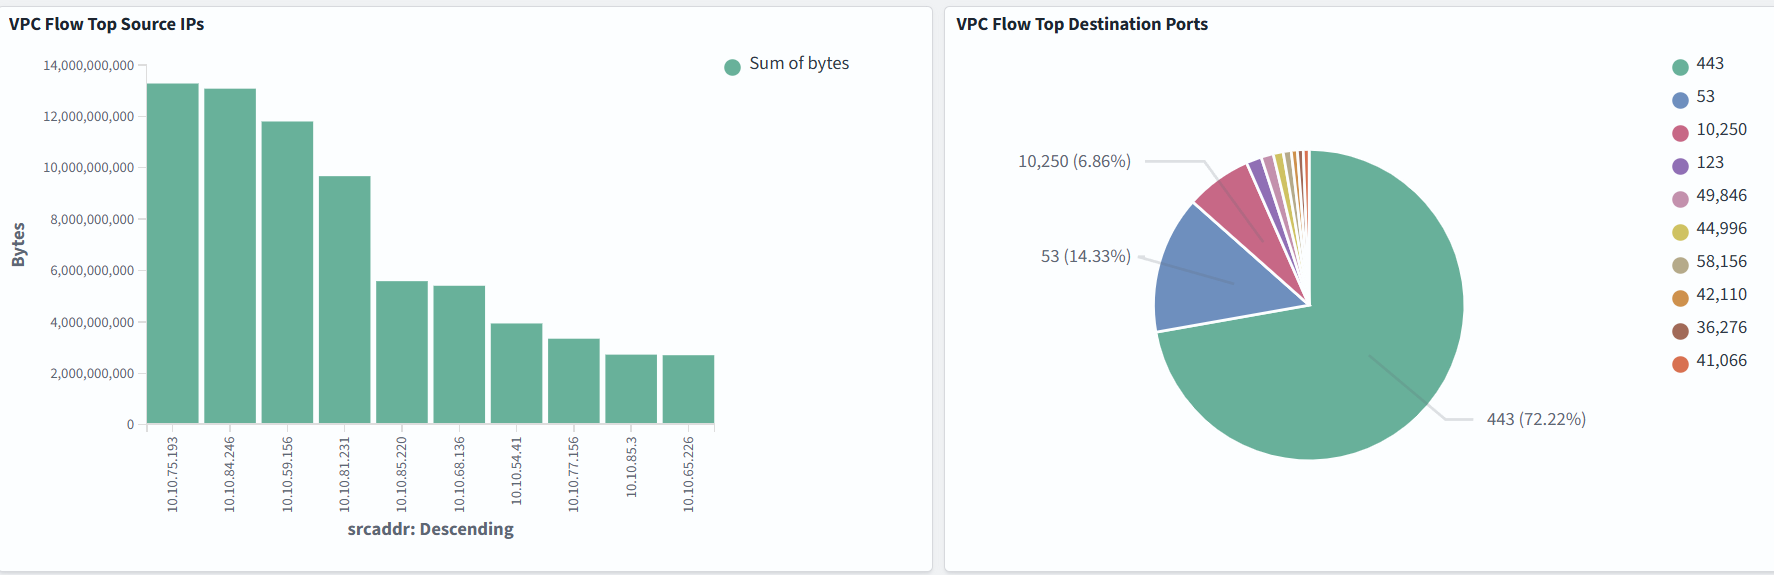
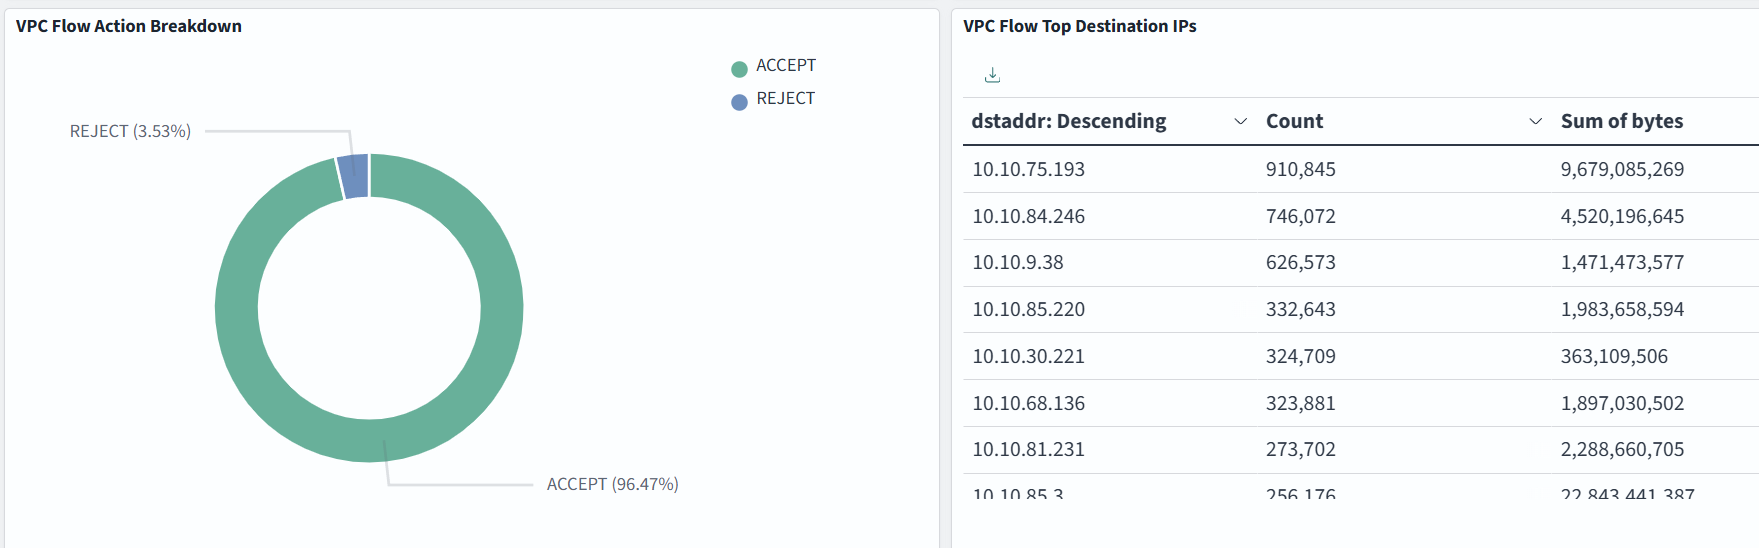
Amazon VPC Flow Logs
VPC Flow Logs is a feature that enables you to capture information about the IP traffic going to and from network interfaces in your VPC.
This table in AWS docs describes the fields of a VPC Flow log.
Dashboard samples are available here, but you can also build your own to suit your needs. In the example below, we monitor Top Source IPs, Top Destination Ports, VPC Flow Action Breakdown, Top Destination IPs:
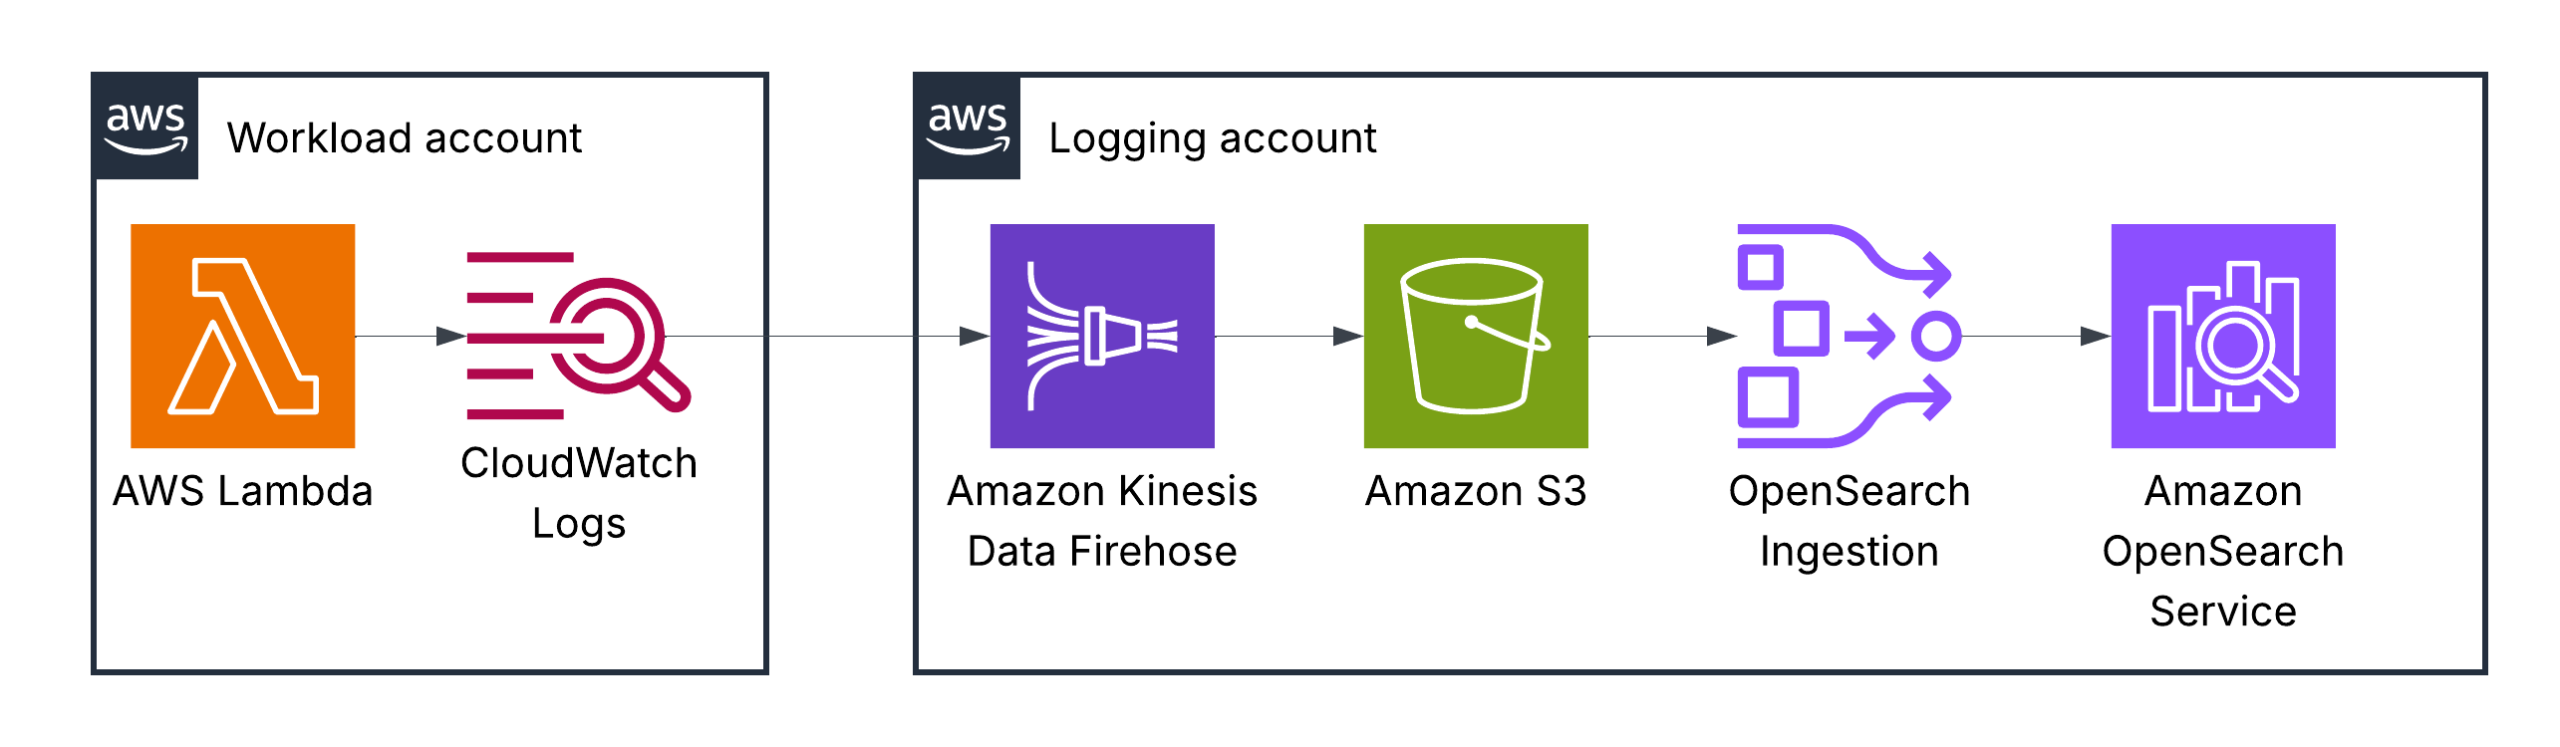
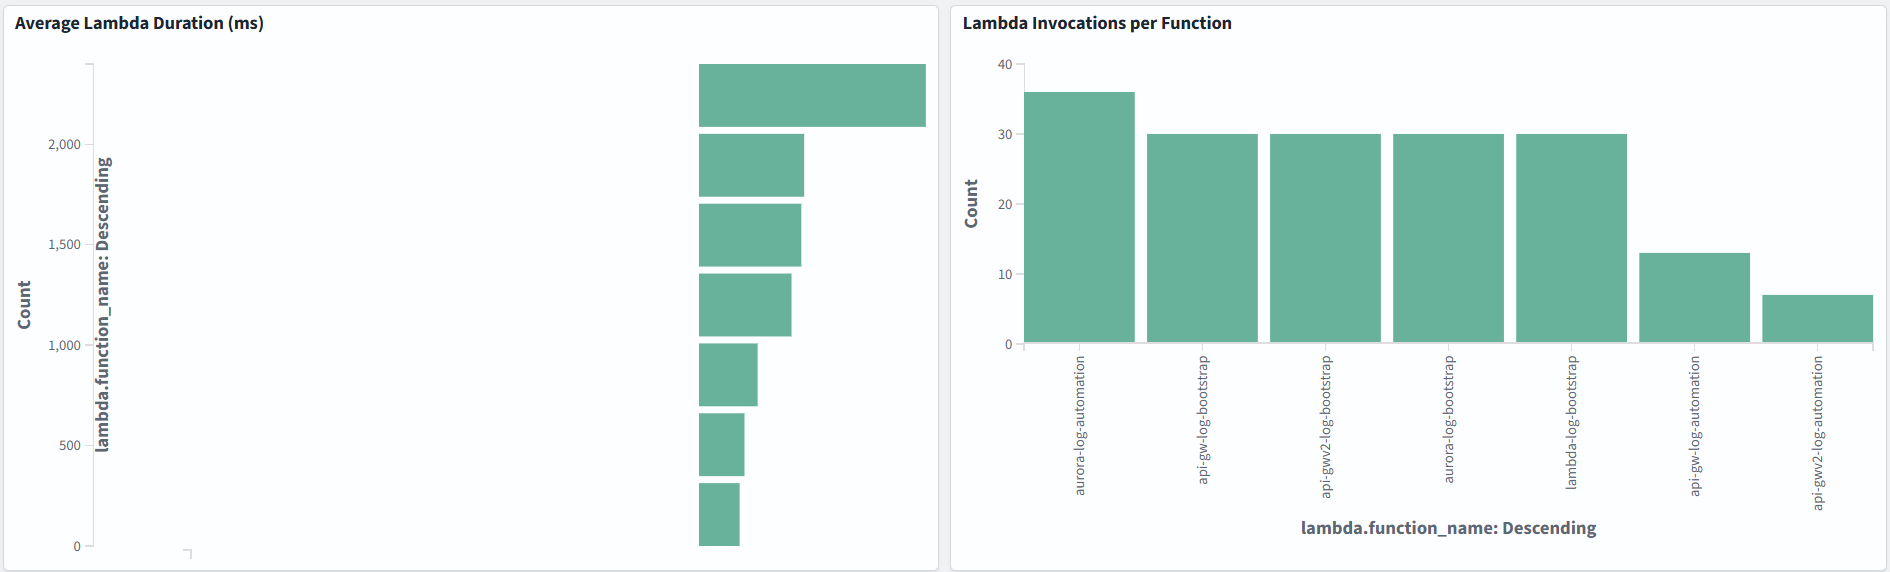
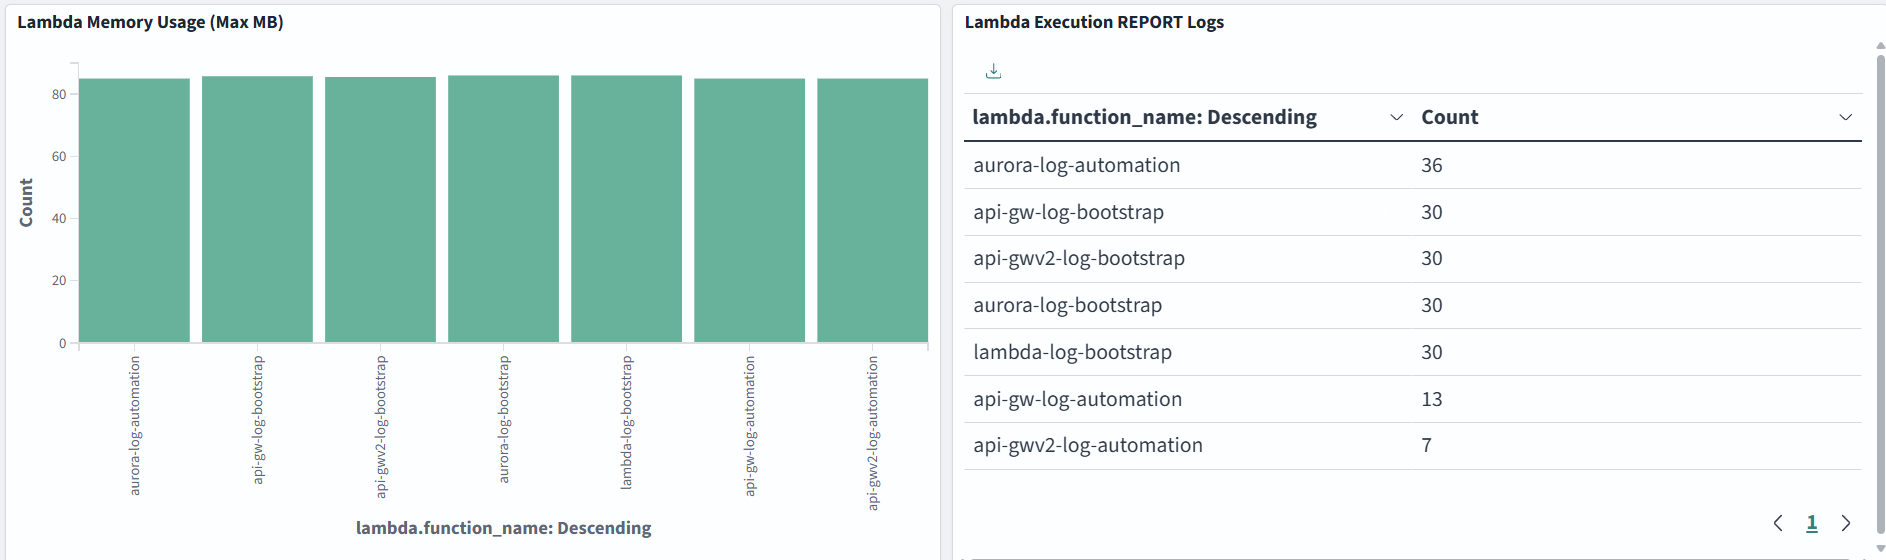
AWS Lambda logs
By default, Lambda automatically captures logs for all function invocations and sends them to CloudWatch Logs, provided your function’s execution role has the necessary permissions. These logs are, by default, stored in a log group named /aws/lambda/<function-name>. To enhance debugging, you can insert custom logging statements into your code, which Lambda will seamlessly integrate with CloudWatch Logs.
You are completely responsible for the log format and the information you write to logs when using AWS Lambda functions.
You can visualize a number of errors, execution duration or anything else important for your serverless application:
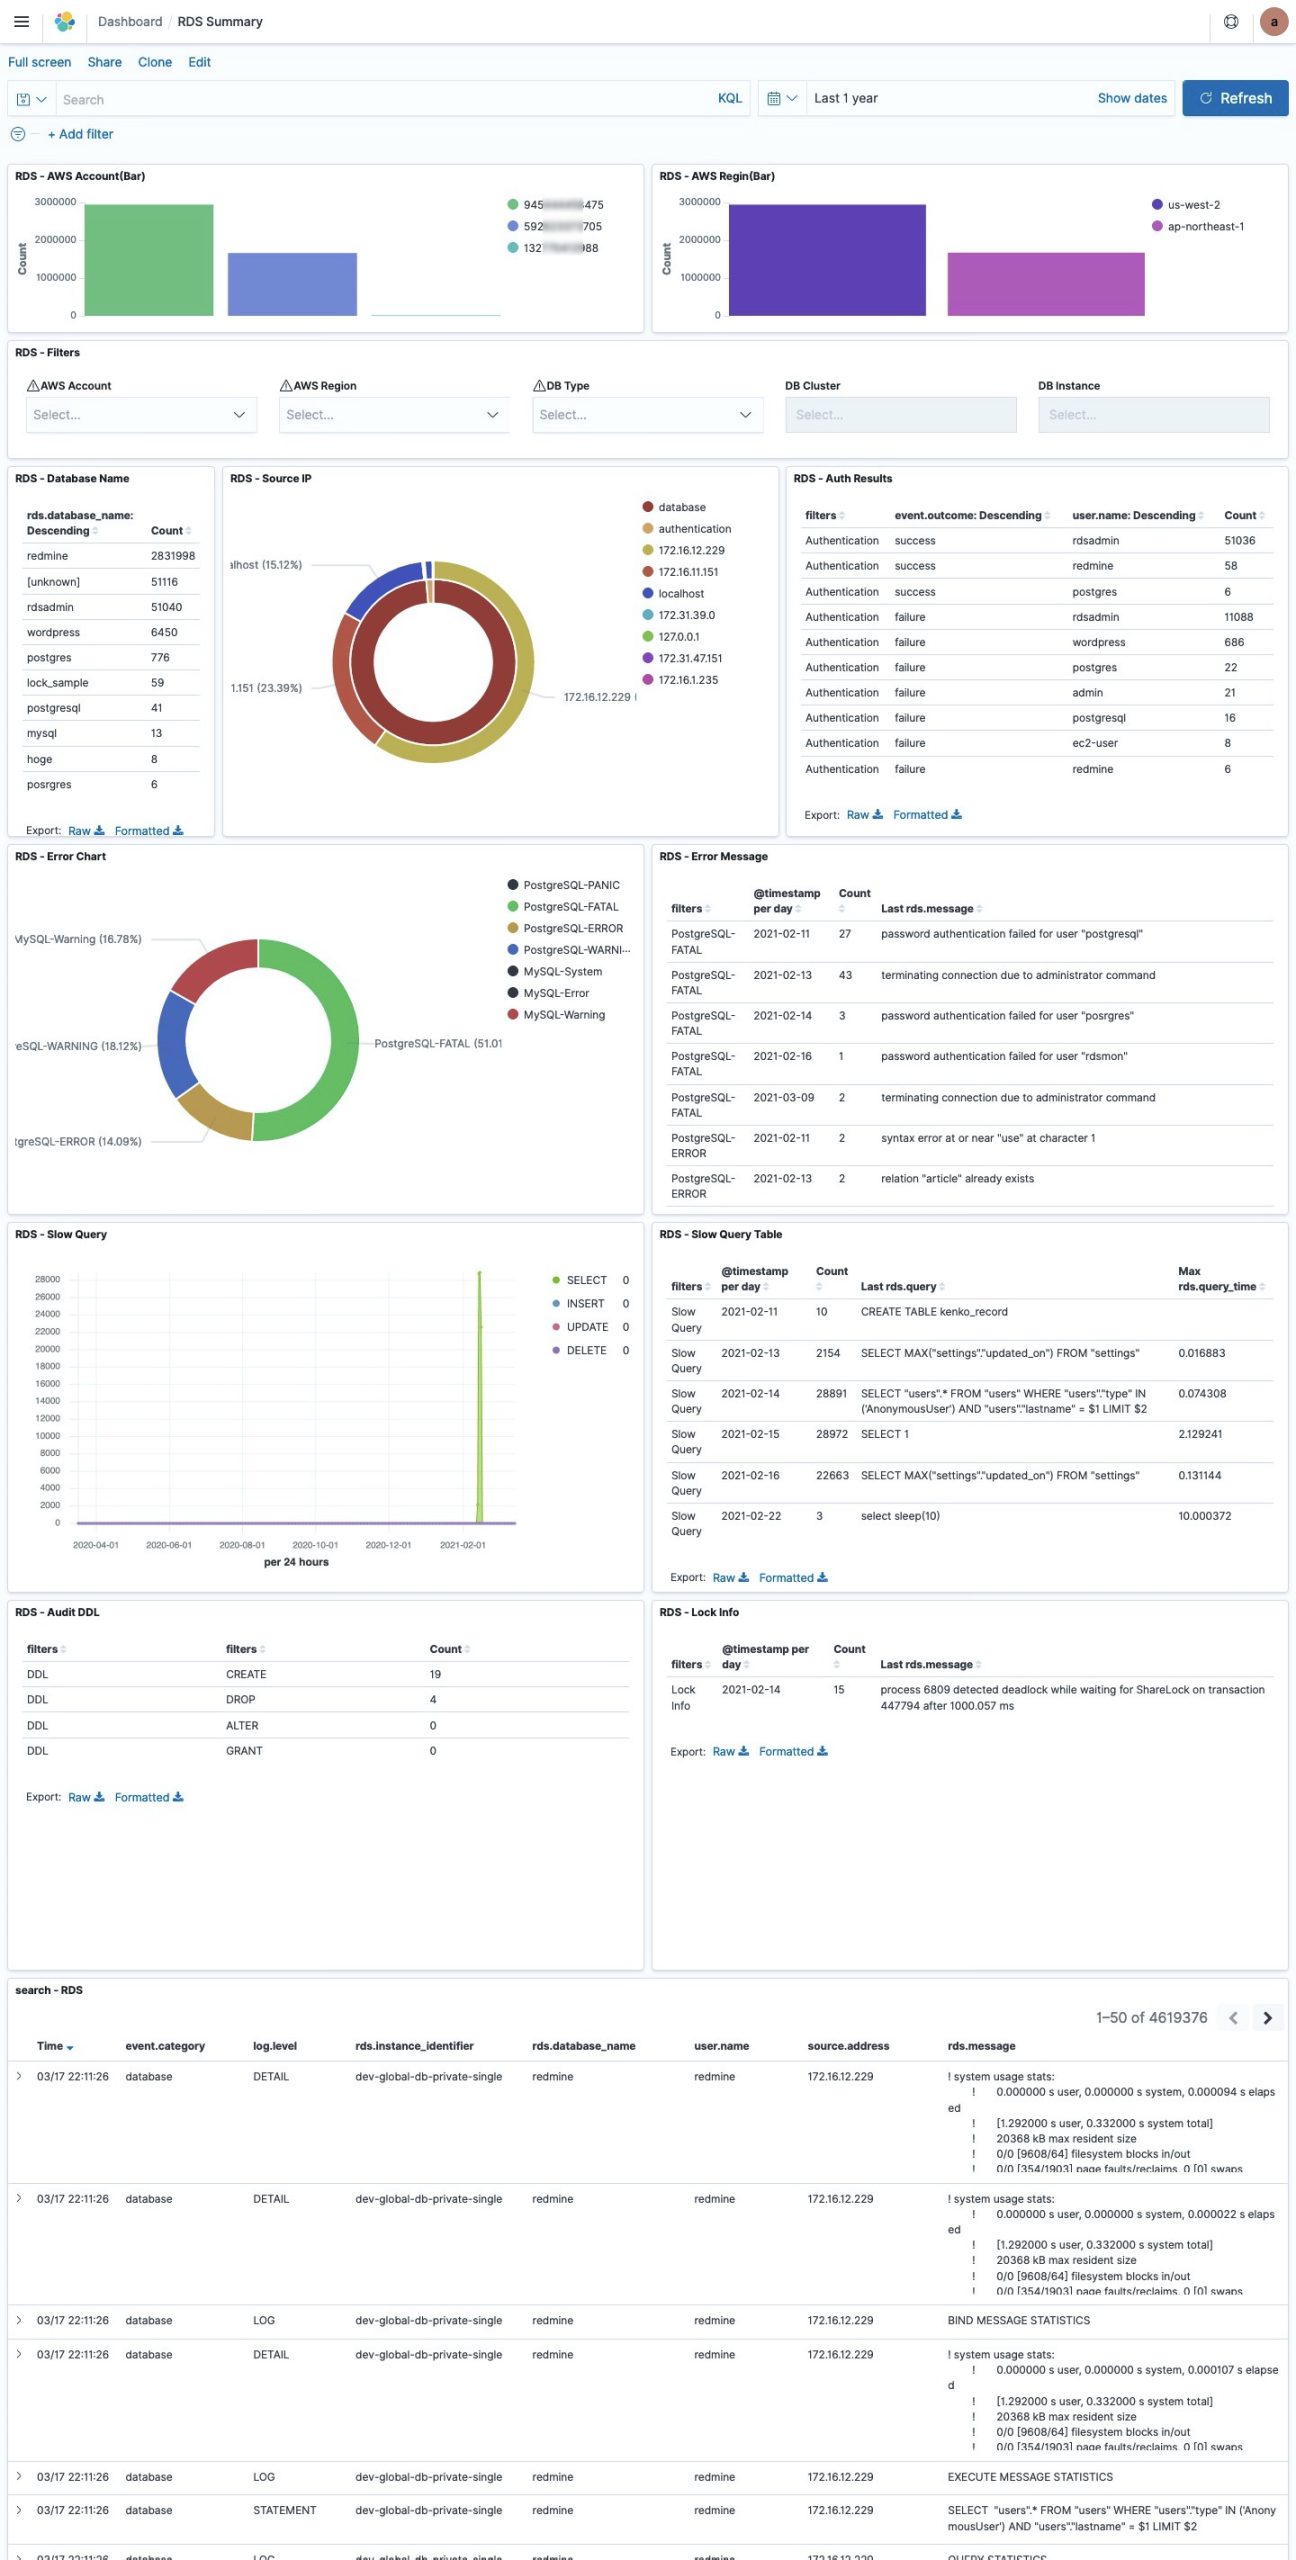
Amazon RDS logs
You can monitor the following types of RDS for MySQL log files:
- Error log
- Slow query log
- General log
- Audit log
- Instance log
- IAM database authentication error log
The RDS for MySQL error log is generated by default. You can generate the slow query and general logs by setting parameters in your DB parameter group.
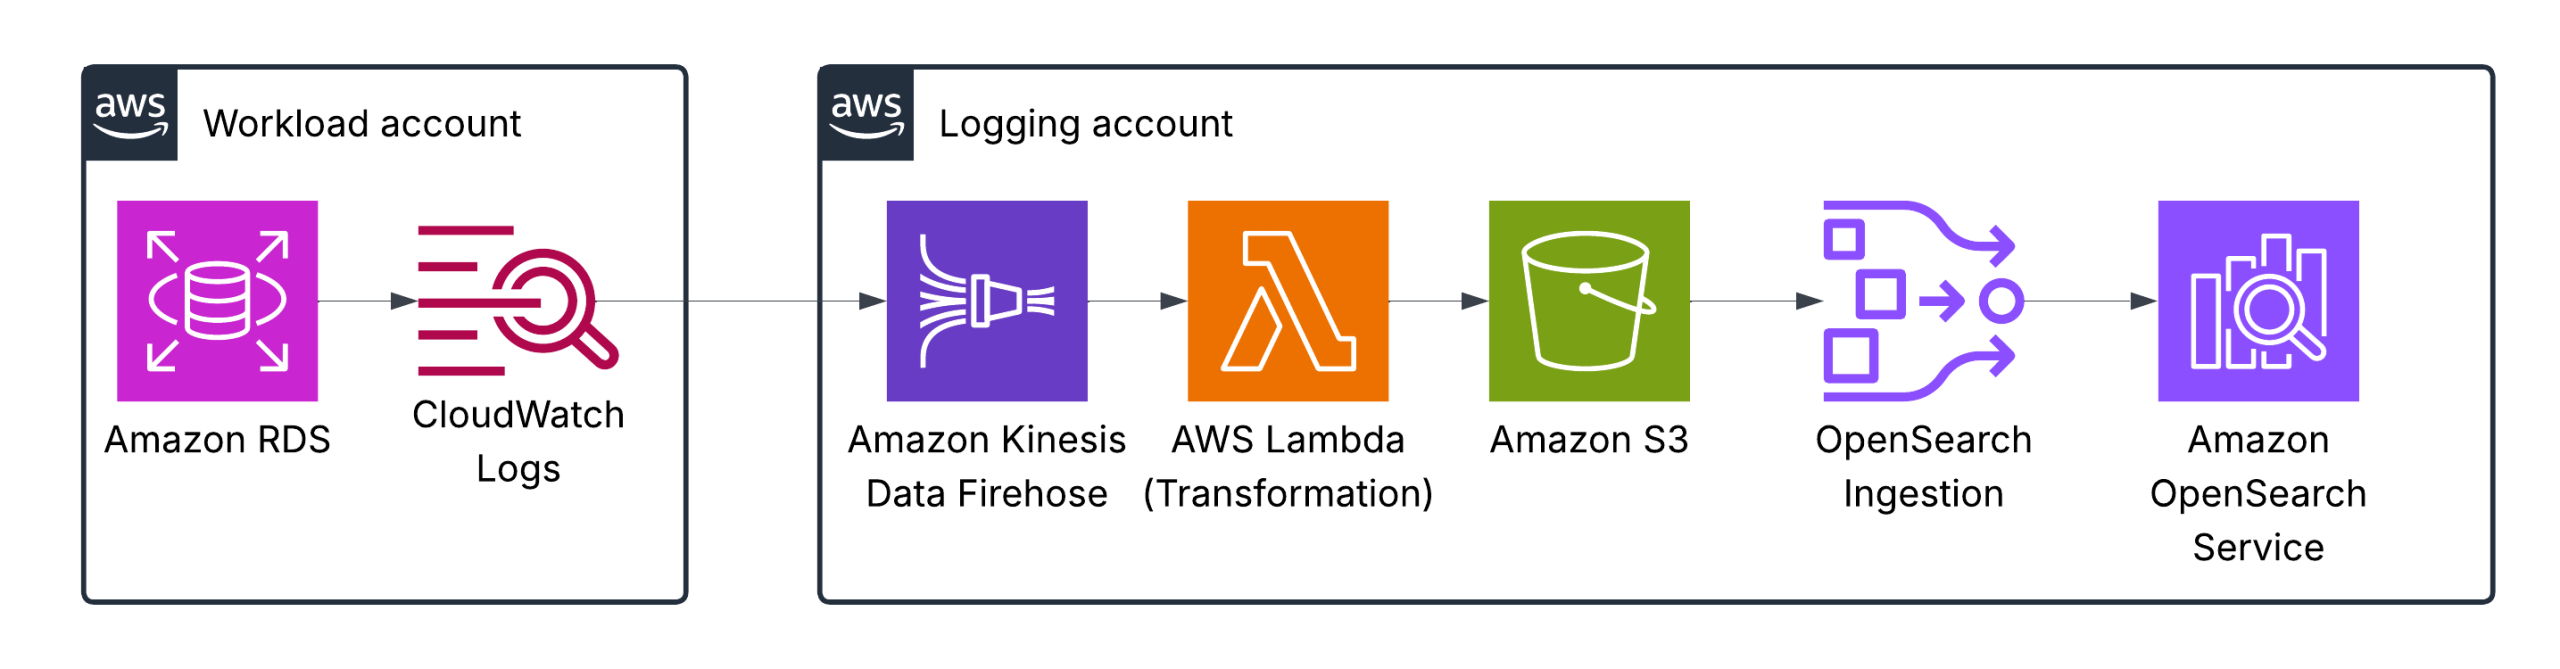
Amazon Kinesis Data Firehose is configured with an AWS Lambda function for log transformation and normalization to ensure the proper format for OpenSearch.
Dashboard samples are available here, but you can also build your own to suit your needs.
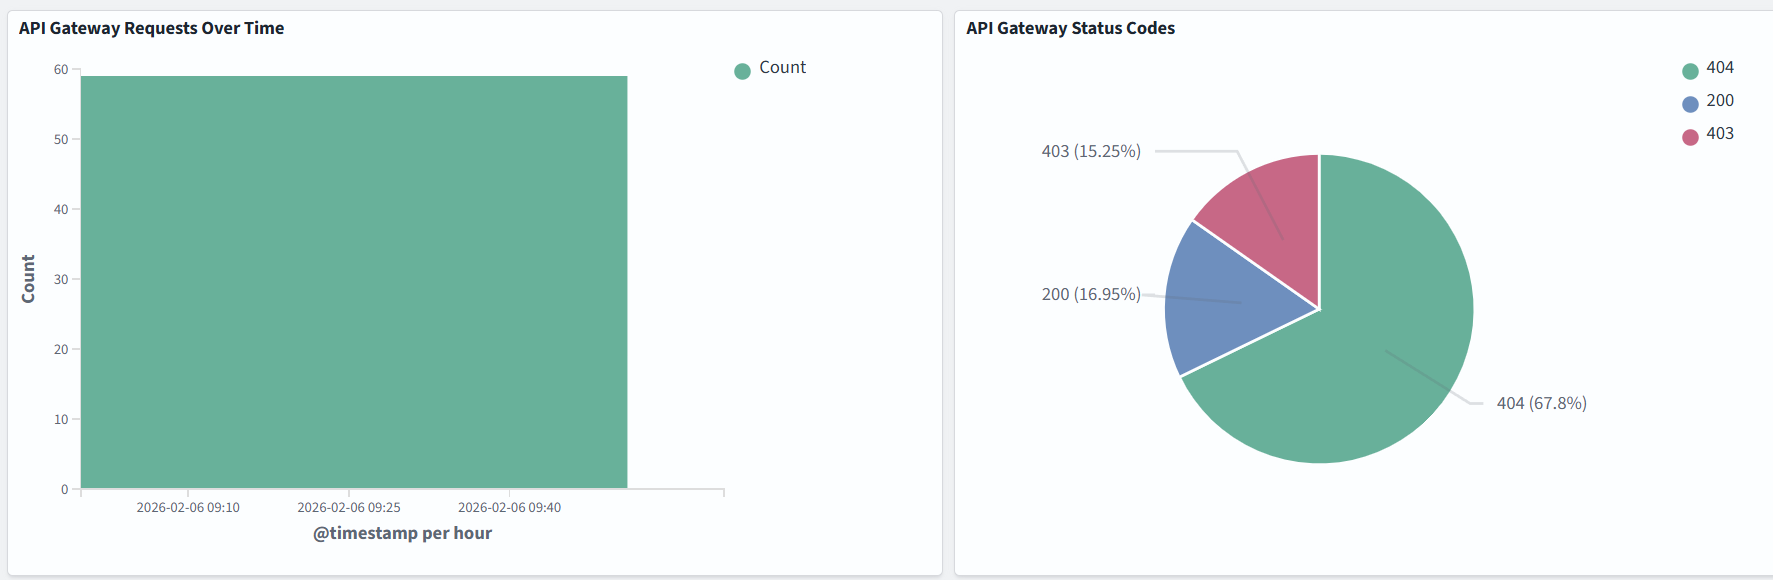
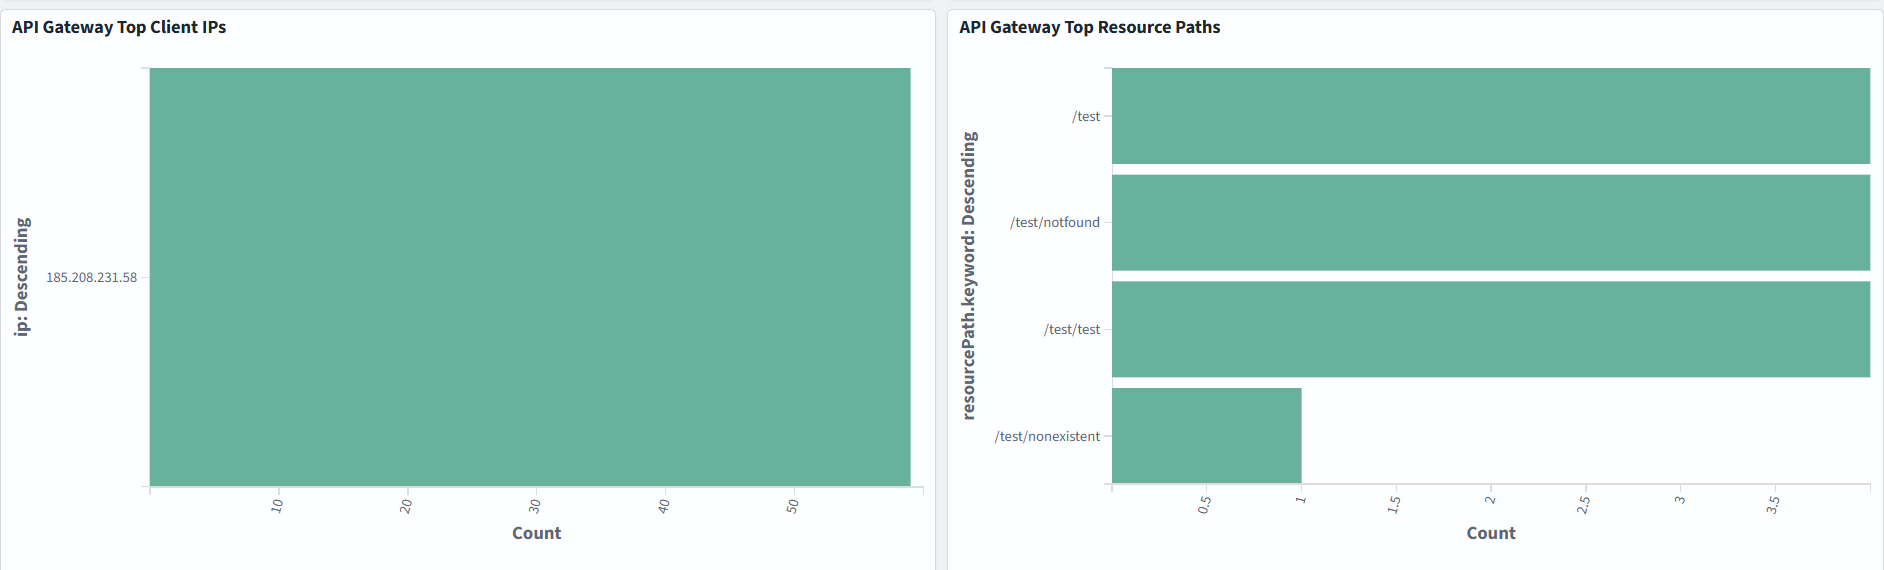
Amazon API Gateway logs
There are two types of API logging in CloudWatch: execution logging and access logging, which record who accessed your API and how the caller accessed it.
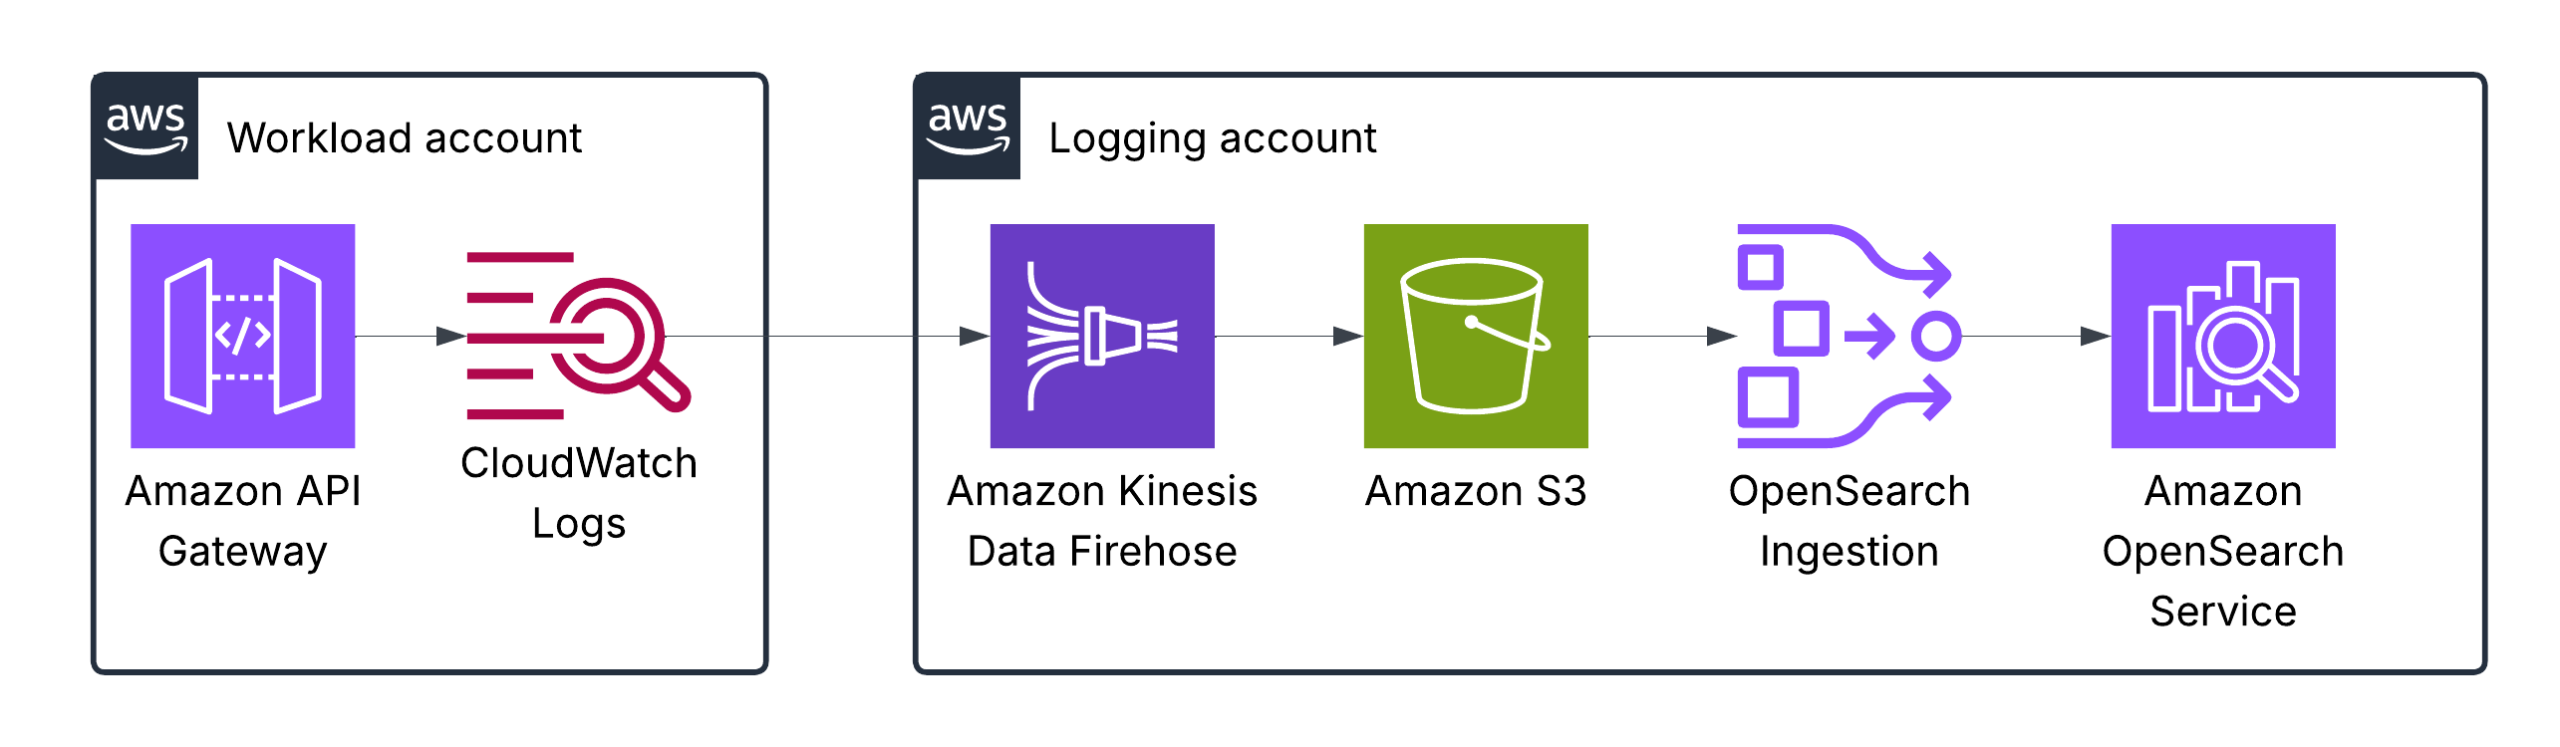
As in the previous example with AWS Lambda, logging and visuzlization depend on your specific use case:
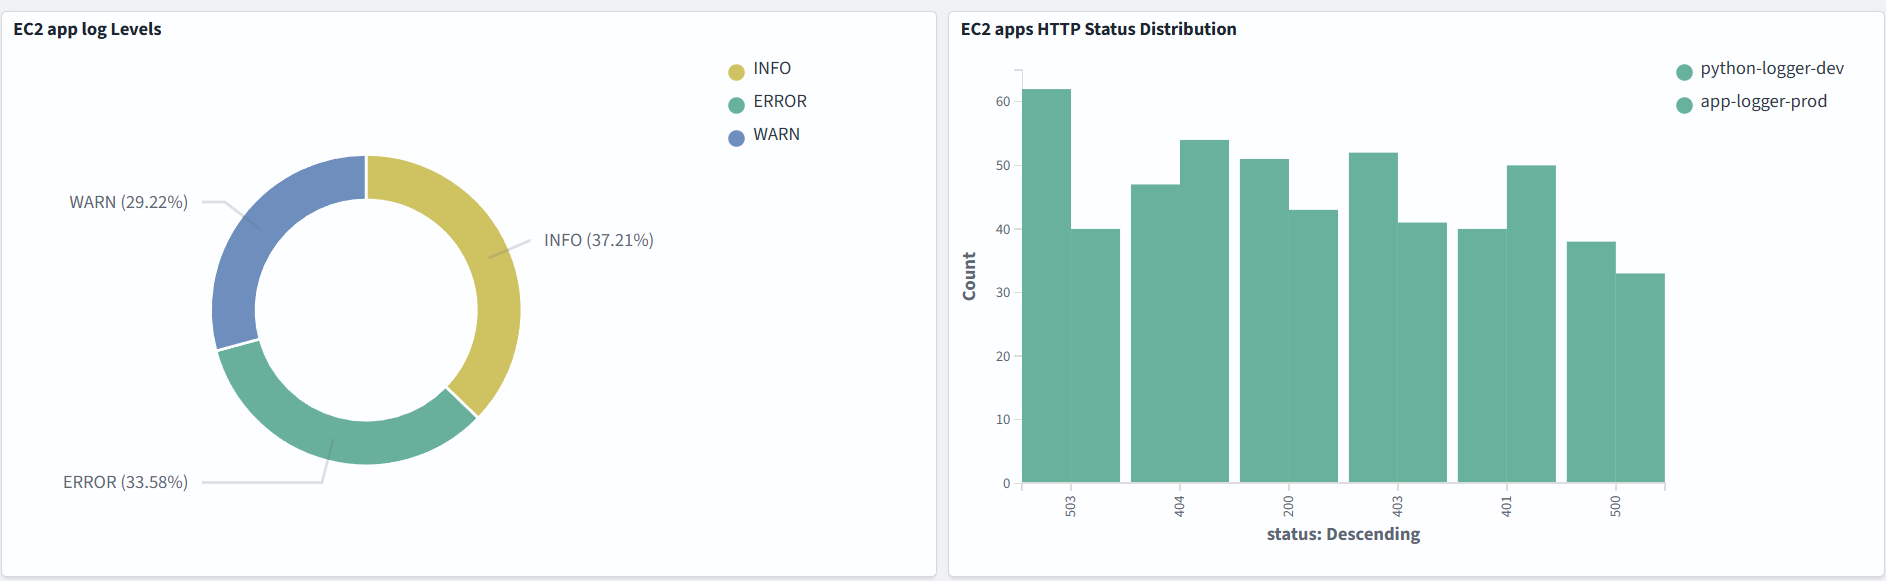
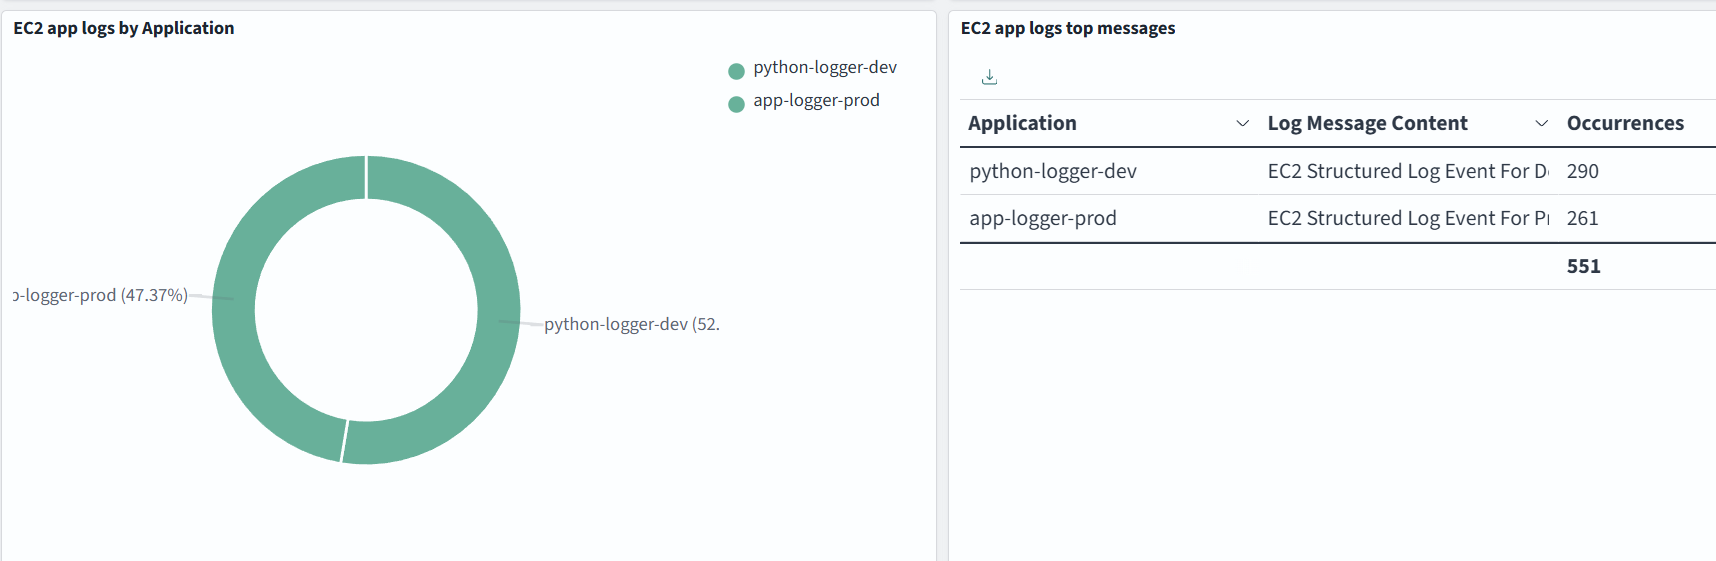
Application logs (EKS, ECS, EC2-based)
The FluentBit agent can run in Kubernetes (EKS), ECS, or an EC2 instance, collect your application logs, transform them if needed, and send them to one or several destinations. In our case, FluentBit sends logs simultaneously to S3 (for long-term) and OpenSearch (for short-term) to avoid using the OpenSearch ingestion pipeline, because we can do it here:
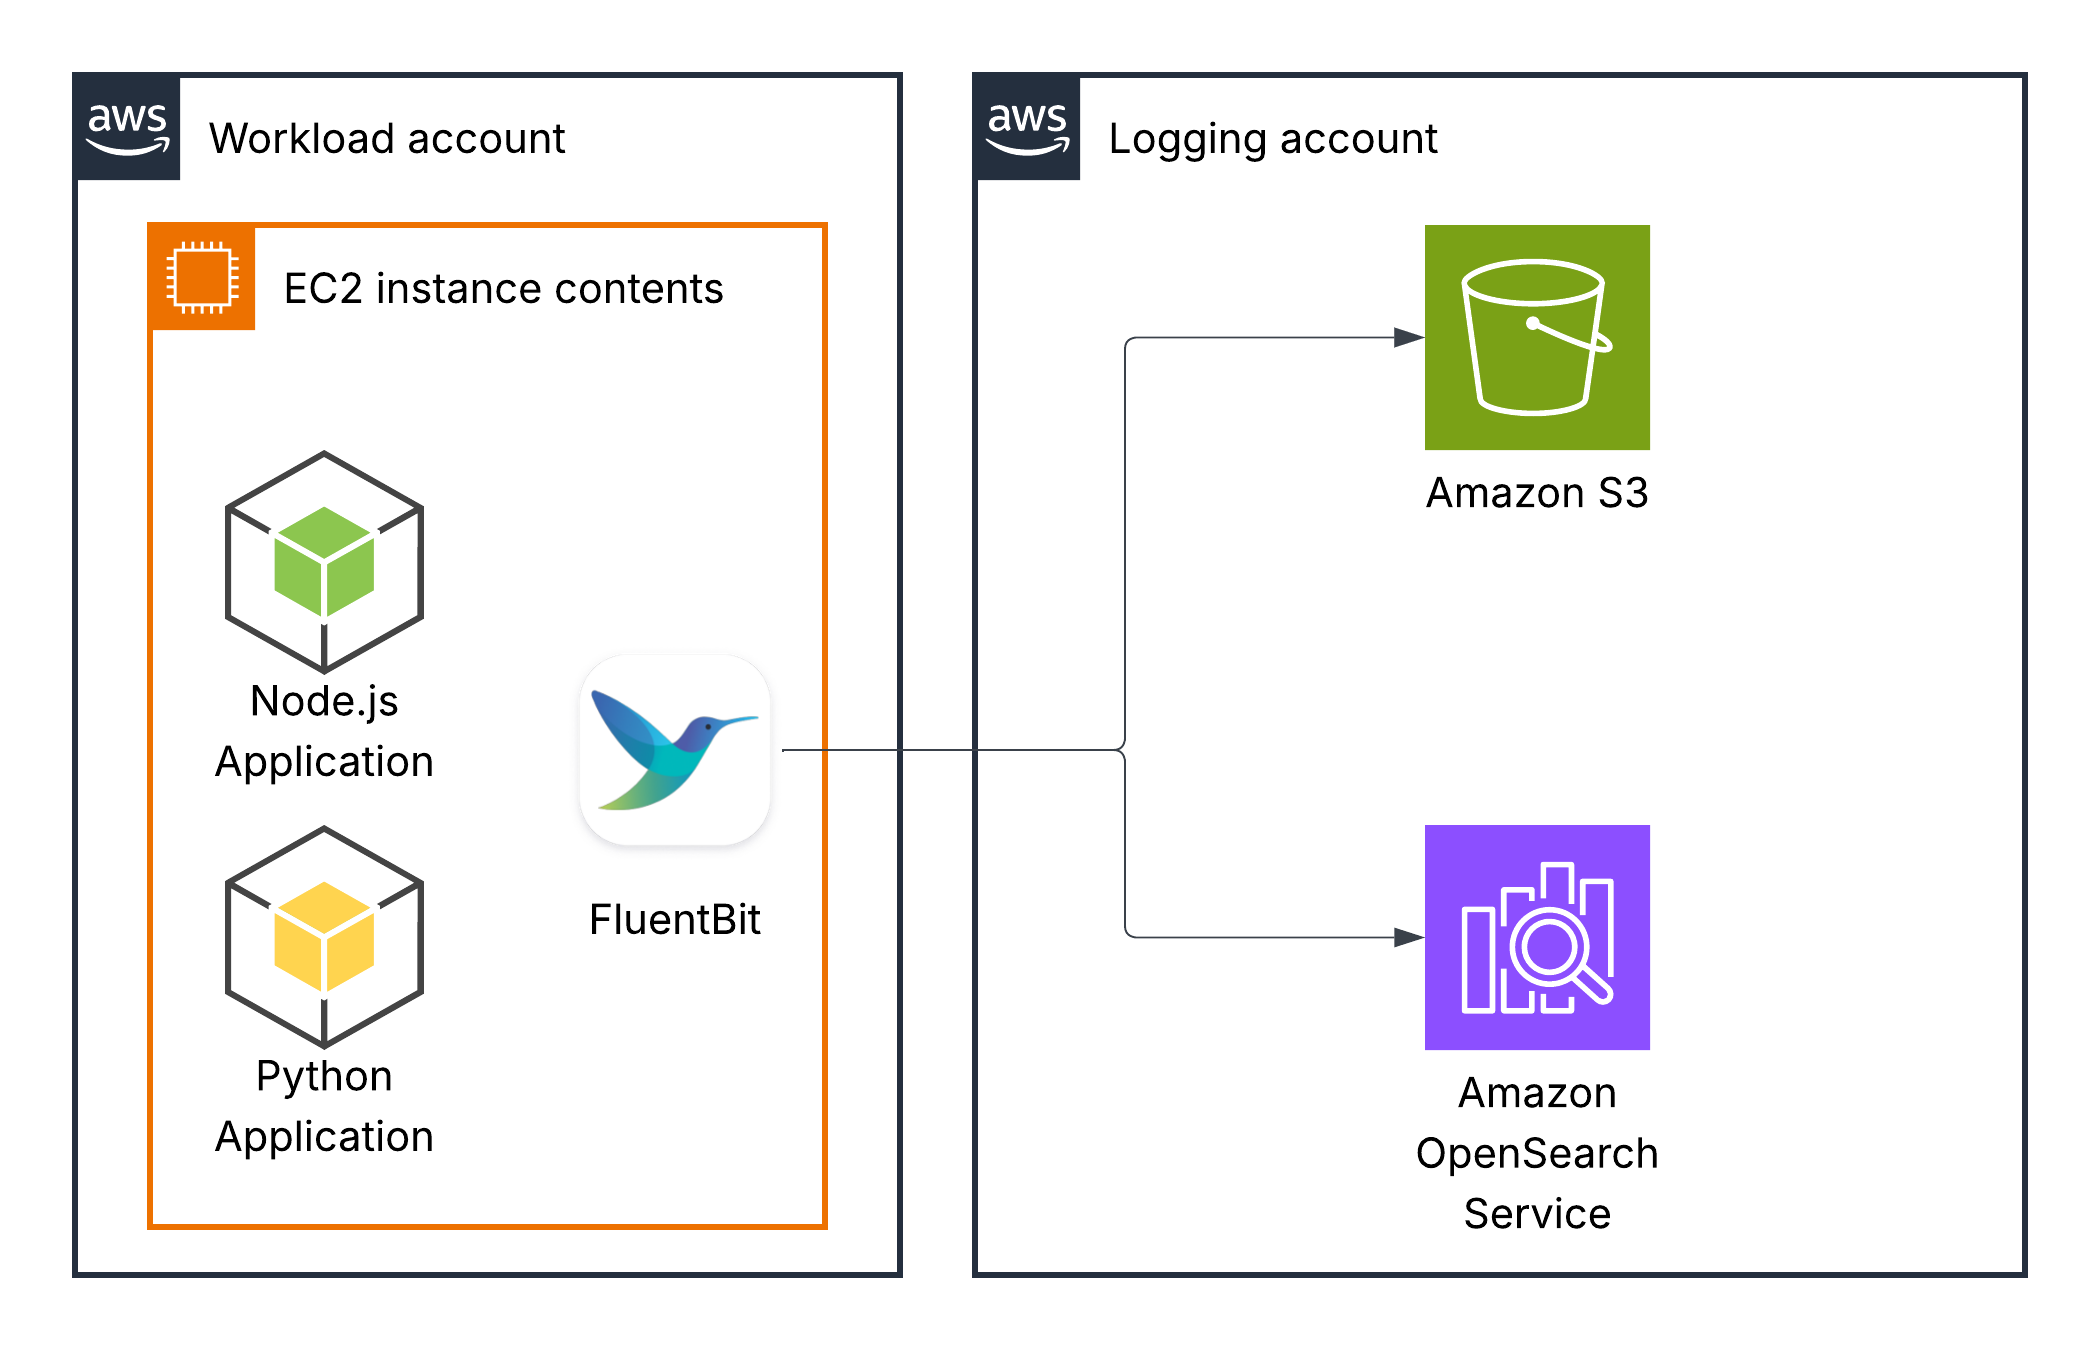
Data in logs, log format and dashboards depend on your specific use cases.
Pricing
Pricing depends on the number of environments and the volume of logs they produce. The more logs you have, the larger the OpenSearch cluster you will need, and the more traffic will be crossing networks. If we take one of the smallest nodes available on Amazon OpenSearch (m8g.medium) and assume a single-node cluster, it will cost approximately $50 per month.
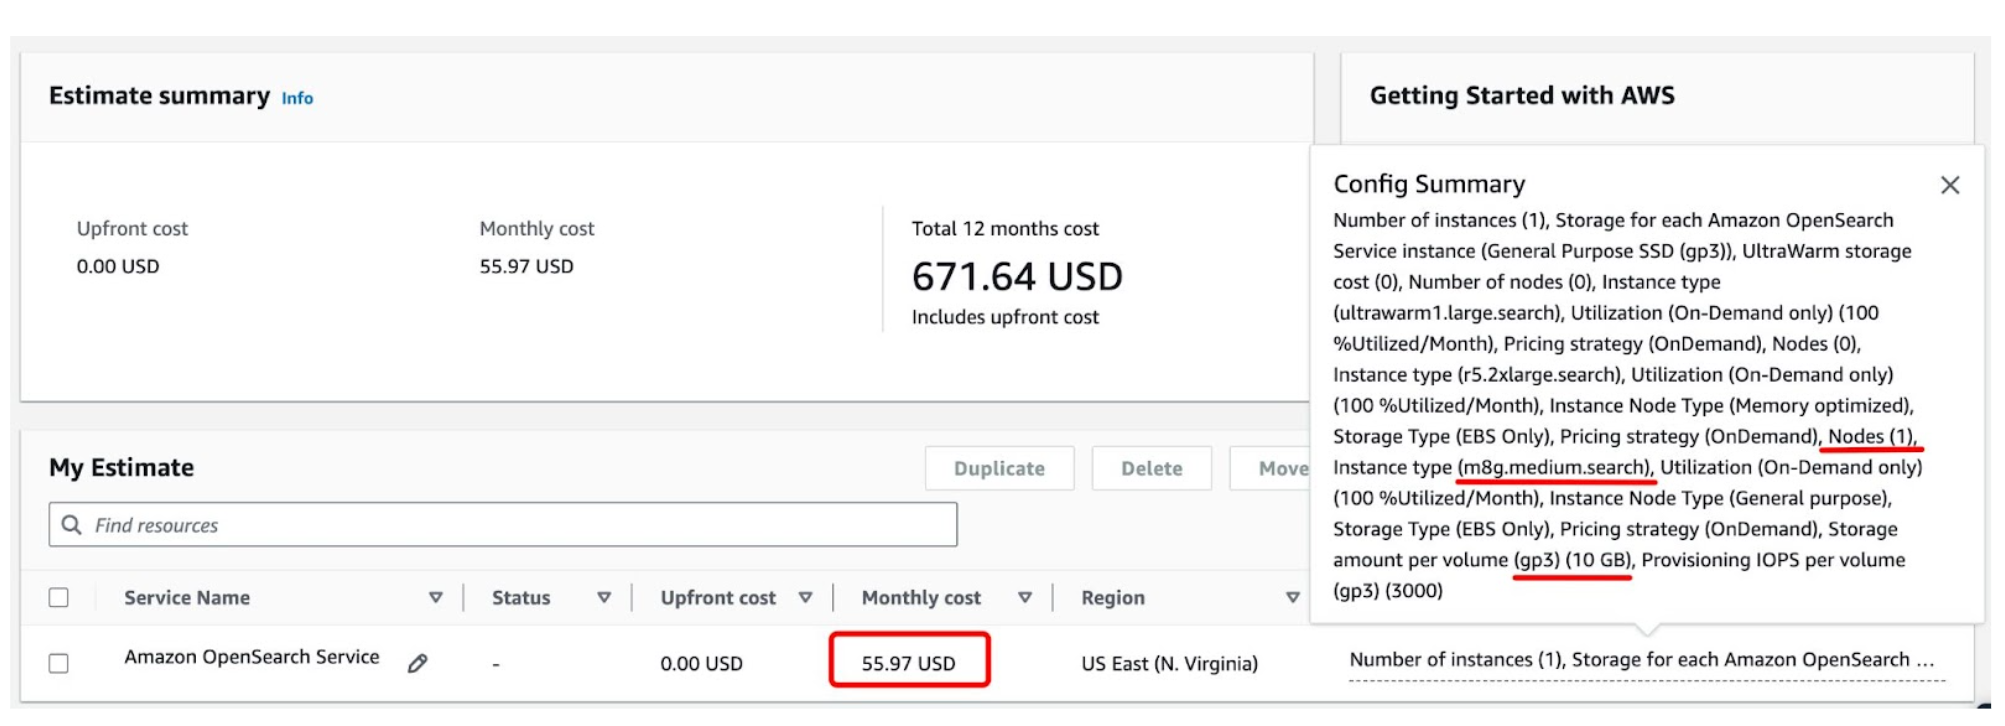
For sure, if we are talking about a production environment, we will need a cluster with several nodes for high availability.
Conclusion
In this post, we’ve described a logging solution for multi-account AWS environments that can be built using Amazon OpenSearch Service to minimise the operational overhead of an open-source, self-managed solution and is much cheaper than commercial logging solutions (Datadog, Splunk, Logz.io, etc.). Scale your visibility, not your operational burden.